Agentic sustainability data: a guide for climate and ESG data teams
Going fully agentic and autonomous does not mean adding a chatbot to the sustainability stack. For climate and sustainability data teams, it means climbing from agents that assist, to agents that run the routine work under your governance, to a data back office that largely runs itself: landing activity data from hundreds of sites, applying the right emission factor release, tying every total to its source, flagging estimates against actuals and keeping the lineage from a reported number to the invoice behind it, while people own the factor choices, the restatements and every published claim. This is what that climb looks like, step by step.
Key takeaways
- •Who this is for. The team that turns activity data (energy bills, fuel, travel, purchased goods, logistics) into the Scope 1, 2 and 3 inventory, the target tracking and the numbers behind the sustainability report.
- •The problem today. Activity data arrives from hundreds of sites as spreadsheets and PDFs, the emission factor library changes version mid-year, supplier data is a mix of estimates and actuals, and when the assurance provider asks which invoice sits behind a reported figure, someone spends days finding it.
- •What changes. Site files are landed, unit-checked and tied to their source totals the day they arrive. A new factor release is applied to a copy, the prior year is recomputed beside it and the difference is shown by scope and category before anything is published. Every figure carries its lineage back to the source file.
- •What stays with your people. Which factor and method you use, any restatement of a published figure, and every target claim: a named owner decides, with before-and-after numbers in front of them.
- •The result. A sustainability data team that spends its year on better coverage, better supplier data and decarbonization analytics instead of rebuilding the inventory and answering "where did this number come from".
The PRD for agentic climate and sustainability data teams
This is the requirements document we would write with you for your team. Everything below expands on it.
| Who | Sustainability data, carbon accounting, ESG data and reporting, climate analytics and sustainability data platform teams at corporates, asset owners and financial institutions |
| The job | A new emission factor release applied and the prior year restated in an afternoon, with every figure traceable to its invoice. |
| Environment | Utility-bill and energy-management exports; fuel card, fleet and travel systems; ERP spend and purchase orders; logistics provider reports; supplier questionnaires and portals; the emission factor library; Snowflake or Databricks; dbt; Airflow or Dagster; Tableau or Looker; sustainability software such as Persefoni, Watershed, Sphera or Workiva. |
| Constraints | Factor and method choices, restatements, published figures and target claims always go to a named owner. Figures that reach a report or an assurance provider must trace to source. |
| Success is measured by | Reported figure traced to its source invoice: from about two days to 15 min; new factor release applied with the prior year restated: from about a week to 2 hours; site energy files tied to source totals: from about three days to 30 min; catalog and docs upkeep closed autonomously 88% of the time. |
| Owned by | A Head of Sustainability Data, with the inventory owner and the sustainability controller as named approvers. |
| Pilot scope | Scope 1 and 2 site activity data and the annual factor update, as a mission at L2. |
What going fully agentic and autonomous means for climate and sustainability data teams
- •Put your data pipeline on autopilot. Utility-bill, fuel and travel export changes are mapped into the inventory mart the day they happen, so the month-end load never silently drops a region because a portal changed its columns or its units.
- •Run the data back office without the busywork. The work that fills the week today moves to agents: chasing site files, converting units, tying totals to the ledger, rebuilding the prior year on the new factors and assembling evidence for the assurance provider.
- •Scale data without scaling headcount. Every new site, acquisition, supplier tier and reporting boundary adds files and definitions. Agents land, map and verify them, so the data you manage grows without the team having to.
- •Get the plumbing off your plate. A sustainability data team that ships coverage, supplier data quality and decarbonization analytics instead of rebuilding the inventory and explaining which version of a number was published.
Who this is for
The team that owns the emissions and sustainability domain as a data product. At a corporate it often sits between the sustainability function, finance and a central data team: a handful of analysts and engineers who collect activity data from facilities, fleets, business travel, procurement and logistics, apply emission factors, and deliver the inventory to the sustainability software the company has chosen and to internal dashboards. At an asset owner or a bank, the same team works on financed and investment-related emissions and on data from investees. At a manufacturer or retailer, procurement and supplier data carry most of the weight.
The titles: Head of Sustainability Data, Director of Carbon Accounting, ESG Data Lead, Sustainability Data Product Manager, Climate Analytics Lead, and the product owners and analysts who report to them. They often run several tools at once, each feeding the sustainability report, the disclosure team, the target tracking and, increasingly, assistants that answer questions about the company's footprint. The team that turns the inventory into regulatory disclosures is covered in the sibling regulatory disclosure data playbook; the wider group is at the ESG and sustainability data teams landing page.
The product you ship
- •The activity data layer: electricity, gas and fuel by site and meter, fleet and fuel-card data, business travel, commuting, waste and water, as governed, reusable data products with units and periods standardized.
- •The emission factor library: every factor with its source, version, year and region, versioned so a number can be recomputed on the factors that were in force when it was first reported.
- •The Scope 1, 2 and 3 inventory: calculated emissions by scope, category, site, business unit and period, including location-based and market-based Scope 2.
- •Supplier and value-chain data: spend-based estimates, supplier-specific data and the flag that says which is which. See the supplier ESG data use case and the Scope 1 to 3 emissions data use case.
- •Target tracking: progress against the base year and against science-based targets, with base-year recalculations recorded.
- •Feeds to sustainability software and reports: the files and tables behind Persefoni, Watershed, Sphera or Workiva, the sustainability report and the disclosure team's datapoints. See the CSRD and ISSB disclosure data use case.
- •Evidence for assurance: lineage from every reported figure to its source and the record of who approved each change. See the audit-ready sustainability reporting use case.
Where the week goes
- •Activity data arrives as files. Hundreds of sites send monthly bills as spreadsheets and PDFs, in different units, periods and layouts. Someone converts, checks and re-keys them before they reach a table.
- •Emission factors change version. A national grid factor set, a fuel factor update or a new global warming potential table lands mid-year, and the question "which factors did we use for which period" has no single answer.
- •Estimates hide among actuals. A missed bill is estimated from last year, a supplier does not respond and a spend-based figure stands in. Months later nobody can say which lines are measured.
- •Scope 3 depends on suppliers. Supplier data comes in questionnaires, portals and emails, with inconsistent boundaries and periods, and quality that varies by supplier tier.
- •Restatements are painful. A boundary change, an acquisition or a corrected factor means recalculating prior years and showing the difference, and every dashboard and report that read the old numbers is now wrong.
- •Definitions are contested. Sustainability, finance and procurement each have a version of "site", "spend", "reporting period" and "business unit".
- •Assurance asks for lineage. The assurance provider picks a reported figure and asks for the calculation, the factor, the activity data and the source invoice. The team rebuilds that trail by hand, per sample.
- •Access is mixed. Supplier-submitted data, spend values and site-level figures need different views for sustainability, finance, procurement and external advisers.
Add it up and upkeep is most of the team's week. Here is how a typical week splits today, and once agents own the back office:
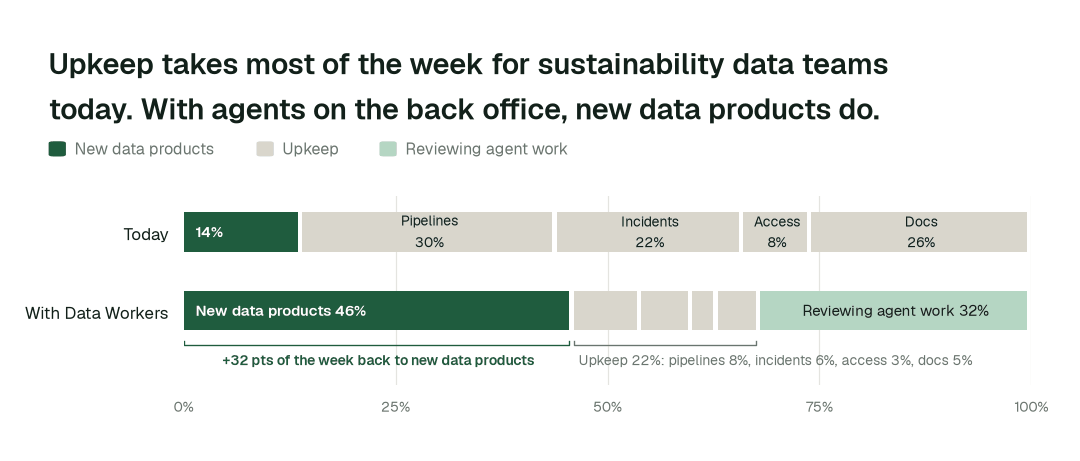
Time spent on new data products moves from 14% of the week to 46%. Most of the rest becomes review: people steer and approve agent work instead of doing it by hand.
Then and now
| Work | Today | With Data Workers |
|---|---|---|
| Site energy files | Converted and re-keyed by hand | Landed, unit-checked and tied to source totals on arrival |
| New factor release | Applied by overwrite, prior years hard to rebuild | Applied as a new version beside the old, prior year restated on a copy |
| Estimates vs actuals | Mixed in one column | Every line flagged, actuals proposed to replace estimates |
| Supplier data | Chased by email, quality unknown | Landed, tagged by method and checked against spend |
| Assurance sample | Trail rebuilt by hand per figure | Lineage and approvals exported as an evidence pack |
| Access to supplier and spend data | Requested by ticket | Scoped to role, logged |
These are the impact metrics we move for climate and sustainability data teams:
- •Reported figure traced to its source invoice: from about two days to 15 min
- •New factor release applied with the prior year restated: from about a week to 2 hours
- •Site energy files tied to source totals: from about three days to 30 min
Across the routine work in this domain:
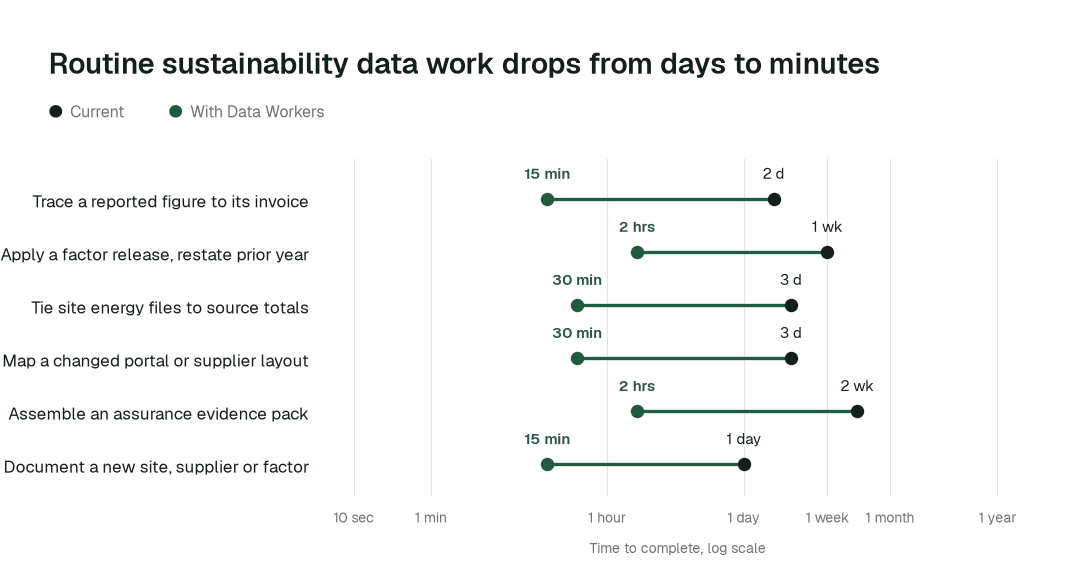
The biggest change is the assurance evidence pack: from about two weeks to 2 hours. Work that waited in queues finishes in minutes or hours, because agents detect, fix and verify in one pass.
Use cases, in depth
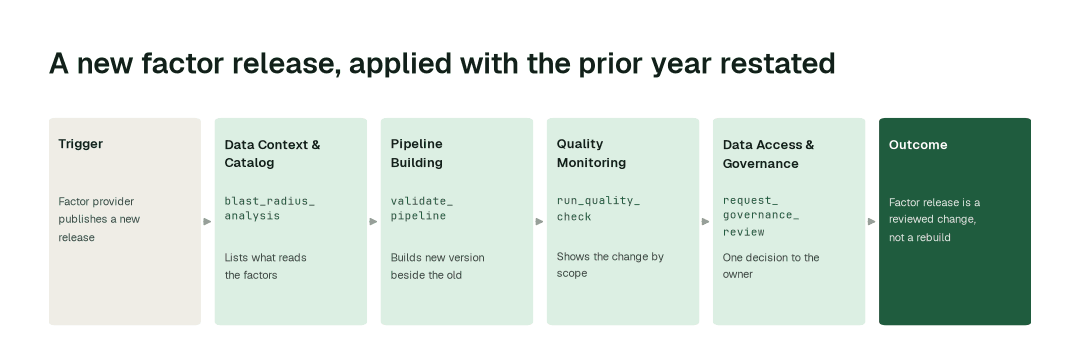
A new emission factor release, applied with the prior year restated
Today. The factor provider publishes a new grid and fuel factor set. The analyst who owns the factor tab downloads it, pastes it over the old one and recalculates. The prior year, the base year and the target tracker are now computed on different factors from the ones used when they were reported, and nobody wrote down which. Three dashboards and a feed to the sustainability software read the old table. When the numbers move, the explanation is assembled by hand, line by line.
With Data Workers. The Data Context & Catalog agent lists every table, model, report and outgoing file that reads the factor library. The Pipeline Building agent creates the new factor set as a version beside the old one rather than overwriting it, recomputes the current and prior year on both, and writes tests that prove the old version still reproduces the published numbers. The Quality Monitoring agent reports the difference by scope, category and site. Because the choice of factors and the method feed published figures, the change goes to the inventory owner as one decision, with the full diff and the tie-out.
What changes. The factor release is a reviewed change with a receipt, and the answer to "why did the number move" is a table, not a week of reconstruction. The GHG Protocol Scope 2 Guidance asks for Scope 2 to be accounted for in two ways, location-based and market-based, and both sit side by side in the mart. Whether a published figure is restated is a separate decision that stays with people.
Tracing a reported figure to the invoice behind it
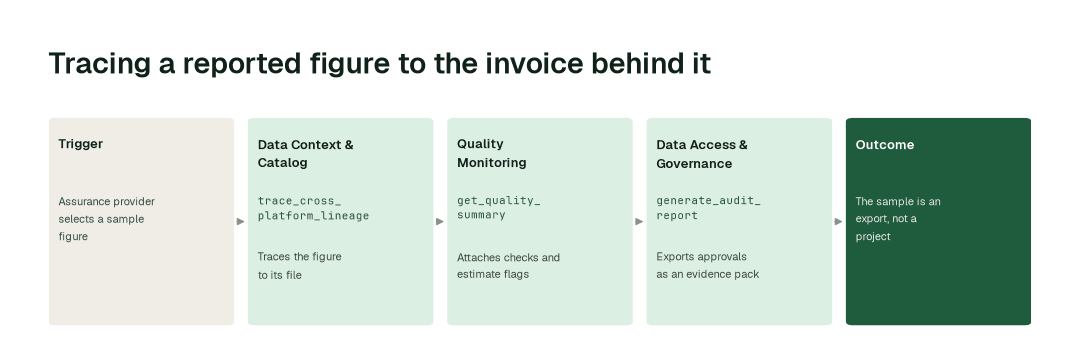
Today. The assurance provider selects a sample: Scope 2 electricity for a region, a fuel total, a business travel number. For each, they ask for the calculation, the factor and version, the activity data, and the source document. The team opens the dashboard, finds the model, finds the spreadsheet a site emailed in March, finds the invoice in a shared drive and builds a trail in a slide or a workbook. Each sample takes a day or more, and a late finding sends the team back through the same steps.
With Data Workers. The Data Context & Catalog agent traces the figure across the warehouse, the transformations and the dashboard to the file it came from. The Quality Monitoring agent attaches the checks that ran on it, including any estimate flags. The Data Access & Governance agent assembles the audit trail: what changed, who approved it and when. The result is an evidence pack for the sample, exported in one step.
What changes. The assurance conversation is about judgment, not retrieval. For the engineering view of how lineage is captured, see automated data lineage and column-level lineage, and for the group's version of this work the end-to-end lineage transformation and the audit evidence on demand transformation.
Replacing a Scope 3 estimate with supplier actuals
Today. Purchased goods and services is the largest category for many companies, and most of it starts as a spend-based estimate: spend by category multiplied by a factor. When a supplier sends actual data, in a questionnaire, a portal export or a PDF, an analyst re-keys it, decides whether it covers the same period and boundary, and swaps it in. The inventory changes, the method changes, and the flag that said "estimate" is lost, so the next quarter's report cannot say what share is measured.
With Data Workers. The Connectors and Data Ingestion agents land the supplier files and profile each load. The Data Context & Catalog agent maps supplier, spend category and period to the same keys the purchase ledger uses, and the Quality Monitoring agent checks the supplier's figure against the spend it should explain, flagging implausible values and mismatched periods. The agents then propose the swap: this line moves from estimate to supplier-specific, here is the change in the total, here is the data behind it. A change of method changes a published number, so the inventory owner approves it.
What changes. The share of Scope 3 that is measured, not modelled, is a number the team can state and defend, and every line keeps its history. The group's supplier ESG data use case goes deeper, and the GHG Protocol Scope 3 Standard sets out the categories it feeds.
For corporates, asset owners and financial institutions
The same swarm covers each shape of sustainability data team, with different data at the edges.
- •Corporates with sites and fleets. Utility bills from hundreds of sites, fuel cards and fleet telematics, refrigerant logs and production data. The hard parts are units, estimated bills and acquisitions that arrive with their own formats. Sites that run on metered energy data have much in common with the utility and grid meter data playbook.
- •Manufacturers and retailers. Procurement, bills of materials and inbound and outbound freight carry most of Scope 3. The hard parts are supplier coverage and linking spend to physical quantities. See the supply planning and inventory data playbook and the logistics and shipment data playbook for the operational data these inventories borrow.
- •Asset owners and banks. Investee and borrower data, financed and portfolio emissions, and data quality scores per holding. The hard parts are mixed reporting periods, estimated versus reported investee figures and the same company appearing under several identifiers.
- •Sustainability software vendors and consultancies. Client data arrives in client formats. The hard parts are onboarding speed, mapping each client's layout and proving each calculation to the client's assurance provider.
Measure the product, not just the pipeline
Sustainability data leaders are judged on whether the inventory survives assurance, whether the footprint is explained when it moves and whether coverage and data quality improve each year, not on table counts. The Autopilot dashboard shows how much of each data product's upkeep runs on its own and at what token cost, so the team can show leadership where its time now goes: wider coverage, better supplier data, decarbonization analytics and numbers that hold up.
Agents working together: The year-end close on a new factor release
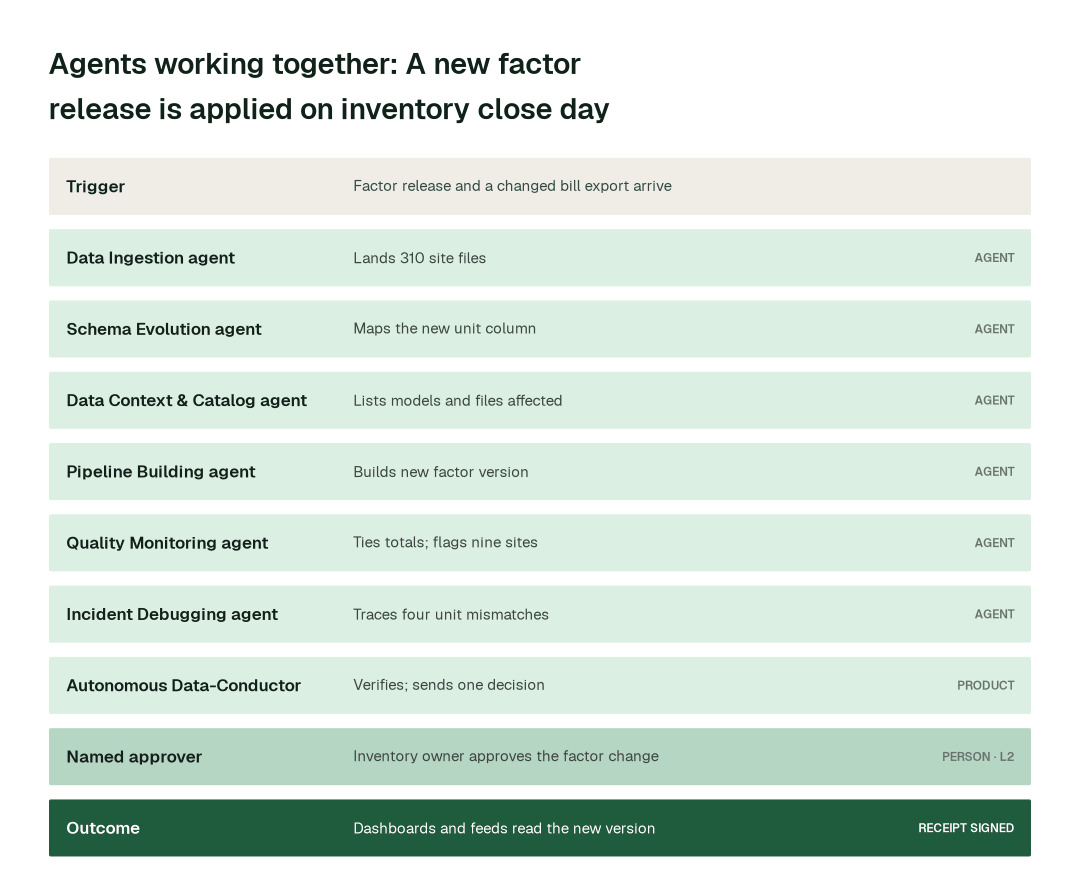
Every sustainability data team knows this week. The year-end inventory is due. The factor provider publishes a new release, one utility portal changes the unit on its export without telling anyone, and suppliers send actuals that should replace the estimates already in the draft. The numbers have to be right, and they have to be provable. This is the same week run by Data Workers.
The setup
The inventory runs as a domain data product on Snowflake and dbt, orchestrated by Airflow. It reads utility-bill exports, fuel card and travel files, ERP spend and supplier files, and it feeds the sustainability software, the report and the target tracker. Autonomy in Autopilot:
- •Staging, unit and layout mapping for activity data, catalog and docs: L2 today; a candidate for L3 on evidence.
- •Emission factor versions, boundaries and methodology: L2, held for the inventory owner.
- •Restated comparatives in the mart: L2, held for the inventory owner and the sustainability controller.
- •Published figures, the decision to restate and target claims: L0, people only. Agents prepare the evidence.
The team scheduled one mission a week earlier: "Recompute the inventory on the new factor release and prove it ties to the published prior year."
07:00: the inputs arrive
The factor provider's new release is available. A utility portal's export now carries energy in megawatt-hours for some regions. Supplier questionnaire responses have landed overnight.
07:04: land the files and map the change
Data Ingestion agent lands the bill exports and supplier files and profiles them: 310 sites, 4 regions with a changed layout. Schema Evolution agent maps the new unit column and the renamed fields into the staging model.
07:15: list what it touches
Data Context & Catalog agent runs a blast radius analysis on the factor tables and the energy columns. It lists the inventory models, three dashboards, the target tracker and two outgoing files to the sustainability software.
07:30: version the factors, recompute both years
Pipeline Building agent creates the new factor set as a version beside the old one, recomputes the current and prior year on both and writes tests that prove the old version still reproduces last year's published totals.
07:50: prove it ties
Quality Monitoring agent runs the checks the team relies on:
- •Site electricity and fuel totals tie to the billing source for every month.
- •Every site reports for every period, or is flagged as estimated.
- •Supplier-specific lines are checked against the spend they replace.
- •Nine sites are flagged: five carry the same reading for twelve months, four show a unit mismatch.
08:05: fix what does not tie
Incident Debugging agent traces the four unit mismatches to the megawatt-hour change and proposes the corrected conversion. For the five repeating readings it lists the sites and the likely cause, an estimated bill carried forward, so site owners can request actual readings.
08:20: keep sensitive data in its lane
Data Access & Governance agent scopes supplier-submitted data and spend values to the roles that may see them and logs the grants. The factor change is routed for review.
08:35: update meaning, then verify
Data Context Wizard updates the governed definitions of location-based and market-based electricity, reporting boundary and estimated versus actual, with provenance, so every dashboard and outgoing file reads the same meaning. Autonomous Data-Conductor compares the new inventory with the prior year by scope and category and checks the restated comparatives against the published figures. Because factors and comparatives sit at L2, Conductor sends one decision to the inventory owner: the diff by scope and category, the tie-out results and the nine flagged sites.
10:10: approved
The inventory owner approves the new factor version for the working inventory and changes the treatment of two sites. Whether to restate the published prior-year figure is not in the decision: that goes to the sustainability controller, with the evidence attached. Conductor applies the approved change and publishes to the mart.
11:00: the downstream tools read the new version
The dashboards and the feed to the sustainability software show the new version. A sampled figure traces from the report to the source file in one click. Nobody files a ticket.
What stays behind
- •The old and new factor versions, with tests, so any year can be reproduced on the factors that were in force.
- •A receipt for every change: who proposed it, who approved it and how to reverse it.
- •Updated Spellbook Data Catalog (in preview) pages for every affected data product.
- •A reusable mission. Next year's factor release runs the same way, and the team can move the routine parts to L3.
Minute by minute
This is an illustrative example. The inventory runs on Snowflake and dbt under Airflow; dashboards and the sustainability software read it at 11:00. Factors and comparatives are at L2.
| Time | Who | What happens |
|---|---|---|
| 07:00 | Factor provider, utility portal | New factor release; one export changes units |
| 07:04 | Data Ingestion agent | 310 sites landed and profiled; 4 regions with a changed layout |
| 07:15 | Data Context & Catalog agent | blast_radius_analysis: models, dashboards and two outgoing files affected |
| 07:30 | Pipeline Building agent | New factor version built beside the old; both years recomputed |
| 07:50 | Quality Monitoring agent | run_quality_check: totals tie; nine sites flagged |
| 08:05 | Incident Debugging agent | get_root_cause traces four unit mismatches |
| 08:20 | Data Access & Governance agent | provision_access scopes supplier and spend data |
| 08:35 | Autonomous Data-Conductor | Inventory verified; factor change held at L2 |
| 10:10 | Spellbook Data Catalog | Inventory owner approves (two sites changed) |
| 11:00 | Sustainability software and dashboards | Read the new version |
The agents on the job
| Agent | What it does on sustainability data | Tools it calls |
|---|---|---|
| Connectors and Data Ingestion | Land utility-bill exports, fuel and travel files, ERP spend and supplier files, and profile every load | get_connector_status, trigger_airflow_dag, get_dbt_run_history |
| Schema Evolution | Maps portal layout and unit changes and new supplier template versions before they reach tables | detect_schema_change, validate_schema_compatibility, generate_migration, rollback_migration |
| Pipeline Building | Builds and versions the activity, factor and inventory models in dbt, with tests, so any year can be recomputed | generate_pipeline, validate_pipeline, deploy_pipeline |
| Quality Monitoring | Ties site totals to billing, flags estimated and repeating readings and checks supplier figures against spend | set_sla, run_quality_check, get_anomalies, get_quality_summary |
| Incident Debugging | Traces a movement in a total to the file, unit, factor or boundary change that caused it | diagnose_incident, get_root_cause, remediate |
| Data Access & Governance | Scopes supplier, spend and site-level data to roles, logs every grant and compiles the audit trail | provision_access, check_policy, request_governance_review, generate_audit_report |
| Data Context & Catalog | Keeps every data product discoverable with owner, SLA, lineage and consumers, and traces a figure to its source | trace_cross_platform_lineage, blast_radius_analysis, define_business_rule, generate_documentation |
| Cost Savings & Data Cleanup | Retires duplicate extracts, stale factor tabs and abandoned analyst workbooks | get_snowflake_usage, get_cost_enrichment, detect_dead_assets |
Data Context Wizard holds one governed definition of a site, a reporting period, location-based and market-based electricity, estimated versus actual and each reporting boundary. Dashboards, the feed to the sustainability software and every assistant that answers a question about the footprint use the same definitions, so the number in the report and the number in the answer never disagree. Autonomous Data-Conductor verifies the numbers that matter before the report is drafted and before any outgoing file is sent. Spellbook Data Catalog (in preview) makes each sustainability data product discoverable for the sustainability team, finance and advisers, in plain English.
What goes on autopilot
Once a domain has earned it, this work runs on its own, and each item removes a problem your team deals with today:
- •Site files are landed, unit-checked and tied to their source totals on arrival, so a changed portal export is caught in staging and not at quarter end.
- •Estimated and repeating readings are flagged on every load, so the share of the inventory that is measured is known all year, not reconstructed before assurance.
- •Lineage from each figure to its source stays current, so an assurance sample is an export, not a project.
- •Layout changes in supplier and portal files are mapped the day they happen, so a new template does not silently shift a category.
- •Catalog and documentation upkeep runs by itself, so a new site, supplier or factor shows up documented, with an owner.
Where your people stay in charge
Agents never get blanket access. Each domain has its own autonomy level, set by you, and it only rises when the receipts show the agents are reliable. Everything starts at L1, observing only; reversible upkeep such as reruns, staging fixes, unit mapping, documentation and cleanup is usually first to run on its own.
- •Emission factor versions, boundaries and methodology always go to a named approver: they change published figures, so the inventory owner approves every change with before-and-after numbers by scope and category.
- •Restated comparatives in the mart go to the inventory owner and the sustainability controller together, with the difference by line.
- •Published figures, the decision to restate and target claims stay entirely with people. An agent never decides that a claim against a science-based target is true; it prepares the evidence for the person who does.
- •Supplier method changes, such as replacing an estimate with supplier data, go to the inventory owner because they move a number.
Once a deployment has matured, here is how that ladder plays out across task classes:
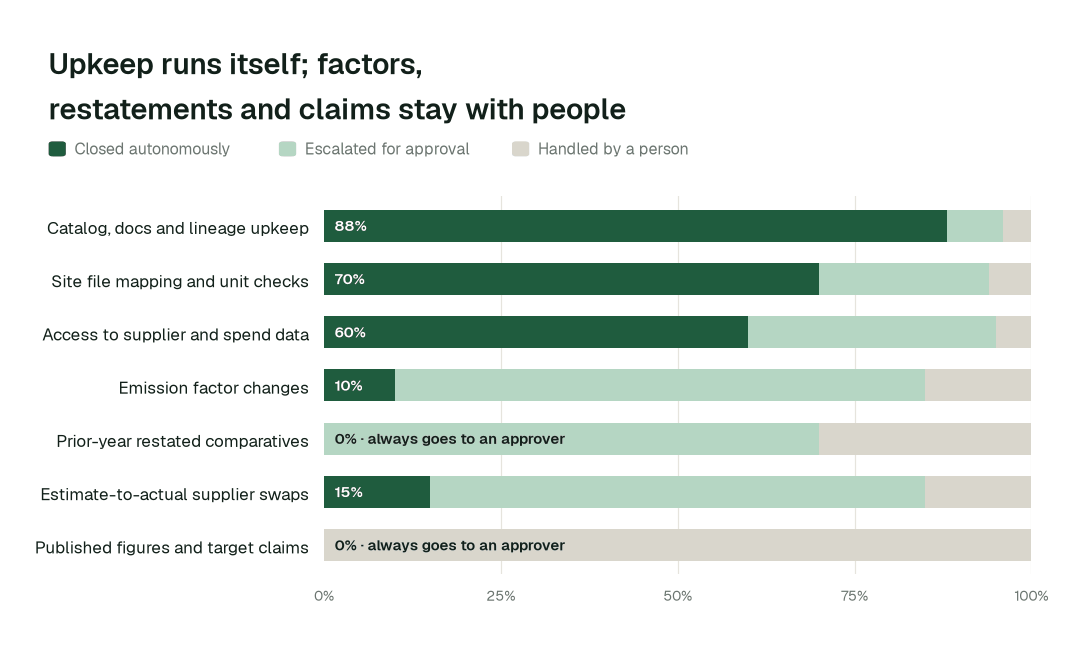
Catalog and docs upkeep closes autonomously 88% of the time. For emission factor changes, autonomous closure is 10% at most by design, and published figures and target claims stay with people: every change is proposed with a full diff and approved by a named person.
What happens when an agent is wrong
- •At L2 propose, nothing changes until a named person approves. The proposal shows the full diff, the blast radius and how to roll it back. Unanswered requests expire and escalate.
- •L3 and L4 are where a domain can go next, on its own review record: acting on its own, with a rollback point on every change. Only the domain's owner raises its level, and if people start reverting the agents' changes, the domain pauses itself.
- •A wrong unit conversion or mapping can be reversed. The previous mapping and the previous factor version are kept, so a figure can be recomputed on exactly what was in force before the change.
- •No agent approves or promotes its own work. Autonomy only grows on evidence, domain by domain, and repeated reverts pause the domain.
- •One org-wide stop halts all autonomous dispatch, and every action lands in a tamper-evident audit trail you can export with
generate_audit_report.
How it fits your stack
Data Workers connects to what you already run: utility-bill and energy-management exports; fuel card, fleet and travel systems; ERP spend and purchase orders; supplier questionnaires and portals; Snowflake or Databricks; dbt; Airflow or Dagster; Tableau or Looker; and the sustainability software your team has chosen. Each agent is an MCP server, so the same agents work inside Claude Code, Cursor or Codex and in Slack or Teams through Spellbook. Nothing migrates.
- •Runs in your infrastructure with your credentials and your model key. The hosted Autonomous Data-Conductor sees workflow metadata only, never rows, so site, spend and supplier data stay where they are.
- •Works beside your sustainability software. Persefoni, Watershed, Sphera and Workiva calculate, manage and report; Data Workers does not replace them. It keeps the warehouse data they are fed correct, current and traceable.
- •Uses the access you already govern. Agents act under scoped service identities and your existing roles; every grant goes through
provision_accessand is logged. - •Proposes changes as diffs in your dbt project, orchestrator and warehouse, with blast radius, tests and a rollback point, and applies them only at the autonomy level you set for that domain.
- •Open-source core. The Apache-2.0 community edition ships 11 agents and 160+ MCP tools, so your engineers can read exactly what the agents call.
Governance and regulation
Sustainability data now has to meet the standard of financial data. The GHG Protocol Corporate Standard is the accounting framework behind most corporate inventories, and it sets out principles such as completeness, consistency and accuracy and when a base year should be recalculated. Disclosure regimes built on top of it, and the assurance that increasingly accompanies them, ask the same questions of your data that an auditor asks of a ledger: where did this come from, who changed it and why. Science-based targets, validated through the Science Based Targets initiative, add a claim that must stay consistent with the inventory over time. Data Workers keeps lineage from each figure to its source, holds changes to factors, methods and comparatives for a named approver, scopes access to supplier and spend data with provision_access and check_policy, and records every change in a tamper-evident trail you can export with generate_audit_report. For the disclosure side see the regulatory disclosure data playbook and the CSRD and ISSB disclosure data use case. For the engineering view of lineage and audit evidence, see data lineage for compliance and audit trail requirements for data agents.
Data Workers doesn't make you compliant; your controls, people and assessors do. It supplies controls and evidence wherever agents touch data. Not legal advice.
The alternatives climate and sustainability data teams weigh
Build it yourselves. A strong team can wire a coding agent to MCP servers for the warehouse and dbt. The work is everything around it: routing factor and restatement decisions to the right owner, blast radius, rollback, receipts, and current context about every other system.
Sustainability and carbon accounting platforms. Platforms such as Persefoni, Watershed, Sphera and Workiva calculate, manage and report on the data they are given. Data Workers does not replace them; it keeps the warehouse data underneath and around them correct, current, traced and governed, and works with whichever you choose. Disclosure requirements are covered in the regulatory disclosure data playbook.
Observability, catalogs and point tools. Observability alerts, catalogs document, and quality tools test. Data Workers takes their signals, diagnoses, proposes the fix, verifies it and leaves the receipt.
Platform-native agents. Snowflake made its managed MCP server and Cortex Agents generally available on Nov 4, 2025, and Databricks made Genie One generally available on Jun 16, 2026. They are excellent inside their platform; this work crosses the portals, files, ERP, orchestrator, warehouse and BI, and Data Workers works across all of them.
In this space specifically. Spreadsheets remain the default for activity data and factors, and they carry no history of who changed what. Moving the work into governed pipelines is the first step; keeping those pipelines current without growing the team is the one agents carry.
The case for your CTO
What this replaces. Hand-converted site files, factor tabs pasted over last year's, restatements rebuilt from scratch, estimates nobody can separate from actuals and an assurance trail assembled per sample.
What your team gets back. A sustainability data team that ships coverage, supplier data quality and decarbonization analytics instead of rebuilding the inventory and explaining which version of a number was published.
Integration effort. Connecting is configuration, not a migration. The agents attach over MCP to the warehouse, orchestrator, dbt project and source systems you already run, under the roles you already govern, inside your own infrastructure. Your engineers can read every tool the agents call in the open-source core.
Risk and control. Autonomy is set per domain. Everything starts at L1, observing only; reversible work moves up only when the receipts justify it; factors, methods and comparatives stay at L2 with a named approver; published figures, restatements and target claims stay with people; and one org-wide stop halts all autonomous work.
Why now. Sustainability numbers are moving from a voluntary report to a figure that is disclosed, assured and relied on. The audit question has arrived: not "what is the number" but "show me how you got it". A footprint assistant built on an untraced inventory only repeats the problem faster.
The first win. Scope 1 and 2 site activity data and the annual factor update, as a mission at L2. The pilot below lays out the scope, what you see each week and the cost.
The climb: from assisted to autonomous to agentic
Our thesis is that the data platform climbs the way analytics did, in stages, and that the hard part of data work was never knowing what to do but doing it. For climate and sustainability data teams, the climb looks like this:
- •Assisted. Agents work alongside your team. They read the whole stack, show what needs doing and propose every fix with a receipt; factors, methods, comparatives and published figures always go to a named owner.
- •Autonomous, under your governance. Routine work runs on its own: site files are landed and tied to their source on arrival, estimated readings are flagged on every load and layout changes in portal and supplier files are mapped the day they happen. Your team governs the agents instead of doing the upkeep.
- •The agentic enterprise. A sustainability data team that ships coverage, supplier data quality and decarbonization analytics instead of rebuilding the inventory. People set direction, and the platform carries it out.
You choose the altitude, every step is visible and reversible, and the pilot below is the first rung.
The pilot: how climate and sustainability data teams start
The pilot is how your team proves the value on its own data before committing.
- •What we connect. Your utility-bill and fuel exports, the factor library, Snowflake or Databricks, dbt, Airflow or Dagster, and Tableau or Looker, over MCP, inside your infrastructure. Nothing migrates.
- •Scope. Scope 1 and 2 site activity data and the annual factor update, as a mission at L2.
- •First week. Agents run at L1 across the scoped domain. They map every pipeline, definition and lineage path and show the fixes they would have made, with receipts, so your team sees the value before anything changes.
- •By week two. Site files tied to source totals on arrival and estimated readings flagged on every load start running on reversible work. Factors, methods and comparatives stay at L2 with a named approver.
- •At day 30. We review the impact metrics against your baseline:
- •Reported figure traced to its source invoice: from about two days to 15 min
- •New factor release applied with the prior year restated: from about a week to 2 hours
- •Site energy files tied to source totals: from about three days to 30 min
- •the share of catalog and docs upkeep closed autonomously, targeting 88% as the deployment matures
- •What you decide. Whether to expand to Scope 3 supplier data or the disclosure feeds. The pilot fee is credited in full against the first year.
- •Cost. Start with a pilot ($7,500 one-time, credited in full against the first year). Scale is from $1,000 a month and Enterprise from $3,000 a month, billed annually, with unlimited seats, no usage meter and no markup on model spend. See pricing.
The pilot is the start of a longer curve:
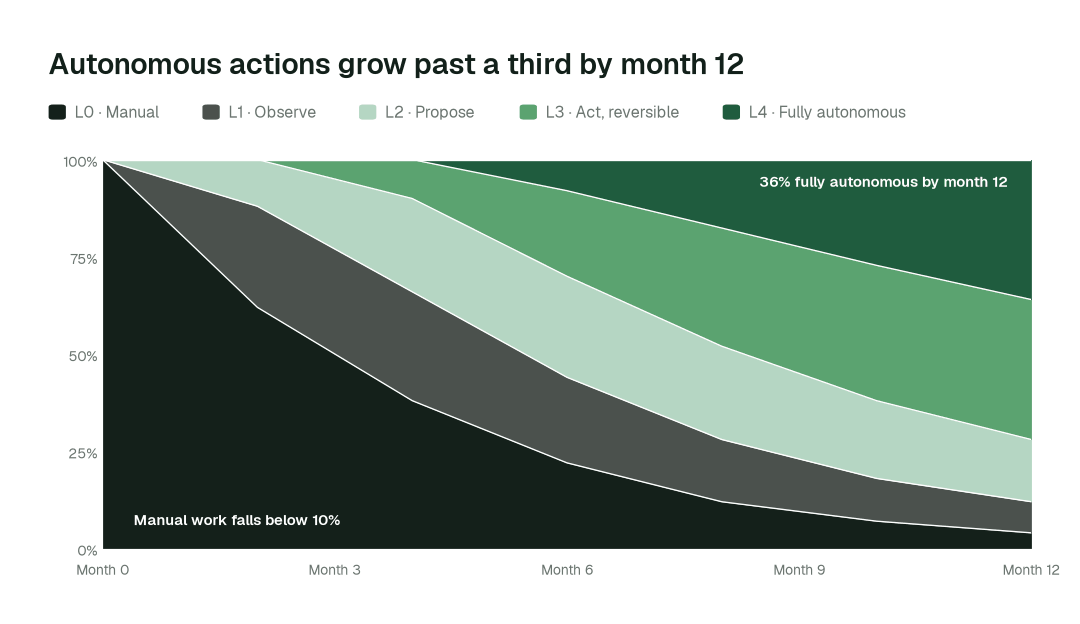
By month 12, more than 36% of agent actions run fully autonomously and manual work falls below 10%, while factors, methods, restatements and target claims stay with a named owner.
FAQ
Does it work with Persefoni, Watershed, Sphera or Workiva? It works beside them. Data Workers keeps the warehouse tables and files that feed them correct and traceable, and does not replace their calculation, management or reporting functions.
Will agents choose emission factors? No. Factor versions, boundaries and methods are L2: proposed with the full diff and approved by the inventory owner.
Will agents restate our published figures or make target claims? No. They prepare the recomputation and the evidence. The decision to restate and every claim against a target stay with named people.
Can it show the source invoice behind a reported number? Yes, as lineage from the figure through the transformations to the source file, with the checks that ran and the approvals on the way. Whether the invoice itself is complete is a question for your controls and assurance provider.
Where does site and supplier data go? Nowhere new. Agents run in your infrastructure with your credentials and model key. The hosted Conductor sees workflow metadata only.
Do we have to migrate anything? No. Your warehouse, dbt project, orchestrator, catalog and BI stay where they are.
Sources
- •Data Workers pricing: https://dataworkers.io/pricing/
- •Greenhouse Gas Protocol, Corporate Accounting and Reporting Standard: https://ghgprotocol.org/corporate-standard
- •Greenhouse Gas Protocol, Scope 2 Guidance: https://ghgprotocol.org/scope-2-guidance
- •Greenhouse Gas Protocol, Corporate Value Chain (Scope 3) Standard: https://ghgprotocol.org/corporate-value-chain-scope-3-standard
- •Science Based Targets initiative: https://sciencebasedtargets.org/
- •Snowflake, managed MCP server and Cortex Agents GA release note (Nov 4, 2025): https://docs.snowflake.com/en/release-notes/2025/other/2025-11-04-cortex-agents-mcp
- •Databricks, Genie One launch (Jun 16, 2026): https://www.databricks.com/company/newsroom/press-releases/databricks-launches-genie-one-all-new-agentic-coworker-every-team