Inside the Observability Agent
Nobody Was Watching Until It Embarrassed You.
Most teams find out a pipeline broke from an angry Slack, not a monitor. Meet the always-on eyes across your whole stack - and the swarm running on it.
You found out from a stakeholder
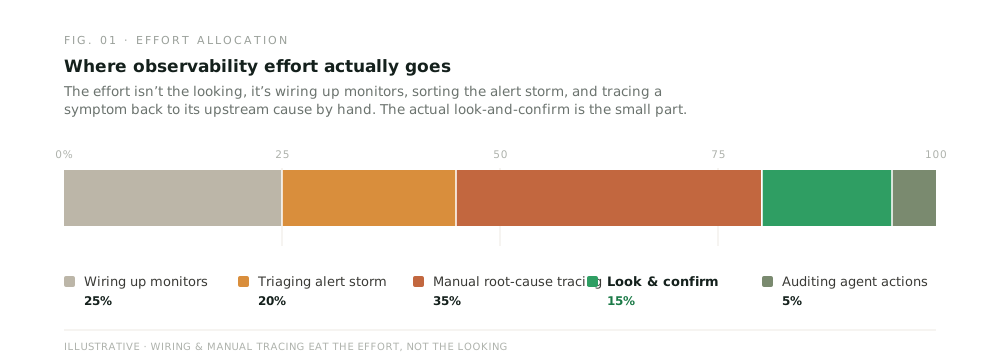
Ask r/dataengineering how people find out a pipeline broke and the answers are bleak: usually from a stakeholder, not a monitor. A dashboard goes blank, finance pings you, and only then do you start opening logs. There's an even darker version of the thread - the data that was quietly wrong for months, where no alert ever fired because nobody was watching the right thing.
The teams that do buy observability often trade one problem for another: a wall of dashboards nobody reads and fifty flapping alerts a day, until the one that matters is buried. And there's a blind spot nobody had a decade ago - there are AI agents running in production now, and who's watching them? The honest question was never "do we have observability," it's "who reads it?" - and the answer was usually nobody, until something embarrassing forced the issue.
What our Observability Agent actually does
The Observability Agent is the always-on eyes across your whole stack - and the only agent pointed at the swarm itself.
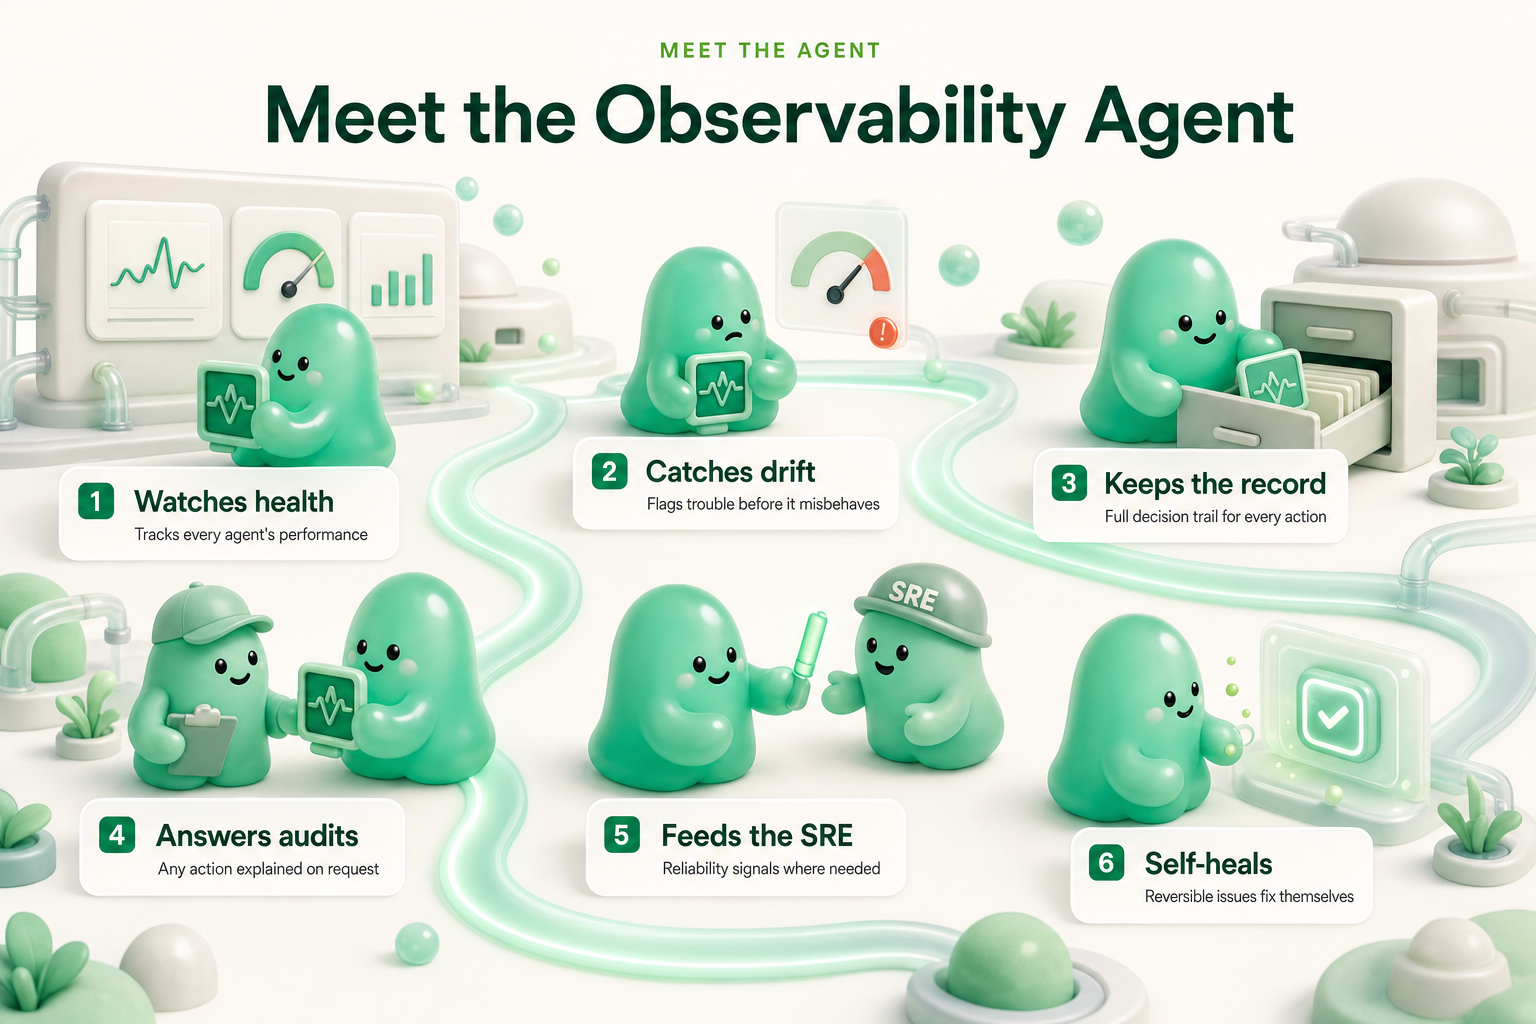
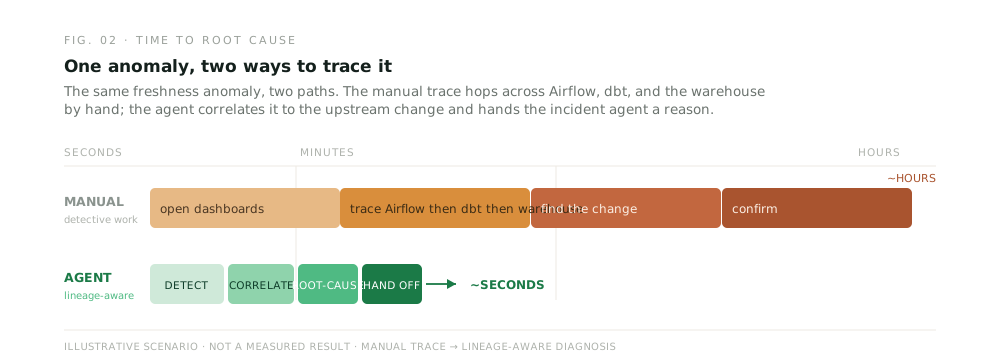
It watches your pipelines, tables, and jobs continuously - nulls, key uniqueness, row counts, and the lateness and volume baselines your team records - so a break or a slow drift is caught by a monitor, not by an angry Slack. It catches the silent degradation that never trips a normal threshold, the data that's quietly wrong before a hundred decisions ride on it. And when something does move, it doesn't just say a table is broken - it correlates the anomaly against your lineage to know what upstream change caused it, and hands the incident agent a root-cause diagnosis so resolution starts from here's why, not start tailing logs. It's also the layer that watches the watchers: agent health, performance, and drift across every deployed agent, with a tamper-evident decision trail for any action - so when an audit asks what an agent did, the answer is a query.
The shape of the win isn't a prettier dashboard - it's not having to open one. A symptom that used to mean an hours-long manual trace across Airflow, dbt, and the warehouse arrives instead as a ready diagnosis: the anomaly, the upstream change that caused it, and the affected chain - handed straight to the agent that fixes it.
Here's the reframe: observability isn't a dashboard you check - it's a colleague who already knows what broke and why before you open one. And it's deliberately the eyes, not the hands: when it finds the cause, the incident agent resolves it, the quality agent confirms the data values are right, the usage agent tells it what's actually in use. Observability watches; the swarm acts on what it sees.
A few of the agent's capabilities
The Observability Agent ships with a deep toolkit. A sampling of what it can do:
| Capability | What it does |
|---|---|
| Always-on stack watch | Continuously monitors pipelines, tables, and jobs across every connected platform - no dashboard to remember to open. |
| Lateness & volume baselines | Tracks the lateness and volume baselines your team records, and flags a late or thin table the moment it moves off its baseline. |
| Silent-drift detection | Catches the slow degradation that never trips a normal threshold - the data that's quietly wrong for weeks. |
| Lineage-aware correlation | When something moves, ties the anomaly to the upstream change across the lineage graph, not just to the symptom. |
| Root-cause hand-off | Packages the what-and-why - affected chain, correlated signals, change events - and hands it to the incident agent. |
| Signal over noise | Collapses scattered telemetry and flapping alerts into the few health facts that actually matter. |
| Agent health & performance | Monitors every deployed agent's health and performance - the swarm watching itself. |
| Agent drift detection | Flags an agent drifting from its baseline before it starts misbehaving in production. |
| Decision audit trails | Keeps a tamper-evident record of every agent action, ready as a full decision trail on request. |
| Reliability-loop feed | Feeds the always-on reliability role so reversible issues self-heal; irreversible changes ask first. |
…and these are just a few of many - the agent carries dozens more autonomy skills, with new ones added continuously.
How this is different from data observability tools
The data-observability category is genuinely good at noticing - and we should say so plainly.
Monte Carlo is the incumbent to beat: automatic lineage across hundreds of enterprises, but its ceiling is detection - it tells a human a table is broken and routes the ticket, mostly inside a single warehouse, at a price teams increasingly question. Anomalo delivers rigorous, low-false-positive anomaly detection but stops at a ranked alert in one cloud. Elementary and Great Expectations ride your existing dbt schedule and document beautifully, but the model is a human authors the checks, the framework evaluates them, and the loop ends at an incident handed back to a person. The general infrastructure monitors - Datadog, Splunk - are built for DevOps, not data teams; they tell you a server is down, not that a null rate spiked forty percent in your orders table.
Across all of them the shared gap is the same: detection is the product, and resolution, a cross-cloud lineage-aware picture, and an audit trail over the agents themselves are left to you. That's exactly the seam this agent sits in - it feeds the resolver and watches the swarm, rather than trying to out-monitor Datadog.
The takeaway
Observability became a wall of dashboards nobody reads because it was built as a place you go to look, not a colleague who looks for you - so the teams who needed it most still found out from a stakeholder. An agent that watches continuously, correlates a symptom to its upstream cause, hands the fix to the agent that resolves it, and keeps an audit trail over the swarm itself turns "who's watching?" into a settled question. The point of observability was never the dashboard - it was knowing, before anyone has to ask.
See it on your own stack
Point the agent at the pipelines and dashboards your team depends on - and watch it catch the drift early, trace a symptom to its upstream cause, and hand the fix off before anyone files a ticket. Book a demo to see it on your stack.