Best practices for agentic climate and sustainability data: a field guide for sustainability data teams
A greenhouse gas inventory is built from hundreds of site files, a factor library that changes mid-year and supplier data of uneven quality, and then it is handed to an assurance provider who asks for the invoice behind a number. This field guide sets out seven practices for building an inventory that survives that question: tying every file on arrival, versioning factors, flagging estimates, swapping in supplier actuals, governing definitions, holding method changes for a named owner and keeping lineage to the source. Each shows the old world, the new world and the agents involved.
Ask a head of sustainability data what makes the year-end inventory hard and the answer is rarely the carbon accounting. It is the utility portal that switched an export to megawatt-hours without a notice, the factor tab pasted over last year's, the supplier who sent actuals in a PDF after the draft was frozen, and the assurance provider who picks one number and asks for the invoice behind it.
The mandate is changing with it. Sustainability numbers are becoming figures with the same standard of evidence as a ledger. The trap is that, without automation, the team spends the year rebuilding the inventory and explaining which version of a number was published, and never ships the coverage, supplier data quality and decarbonization analytics it exists to deliver.
Our view: the work that keeps an emissions inventory correct is repeatable, and agents should own it, while people keep the decisions that move a published number. For the full picture of the team and its week, read the playbook for climate and sustainability data teams.
The old world
It is the week the year-end inventory is due. The factor provider has released a new set, and an analyst pastes it over the old factor tab, so the prior year and the base year now sit on different factors from those used when they were reported. A portal export changed units for four regions and the totals still look plausible. Nine sites repeat the same reading because an estimated bill was carried forward. Supplier actuals are re-keyed one at a time, and the "estimate" flag is lost. Then the assurance provider selects a Scope 2 figure and asks for the calculation, the factor version and the invoice. Finding it takes two days, and there are twenty more samples.
The new world
The same week with Data Workers. The new factor release is built as a version beside the old one, both years are recomputed and tests prove the old version still reproduces last year's published totals. The changed export is mapped at the boundary and the unit mismatches are traced to their cause. Estimated and repeating readings are flagged on every load, and supplier actuals arrive as a proposed swap. The inventory owner sees one decision with the difference by scope and category, and a restatement of a published figure goes to the sustainability controller with the evidence attached.
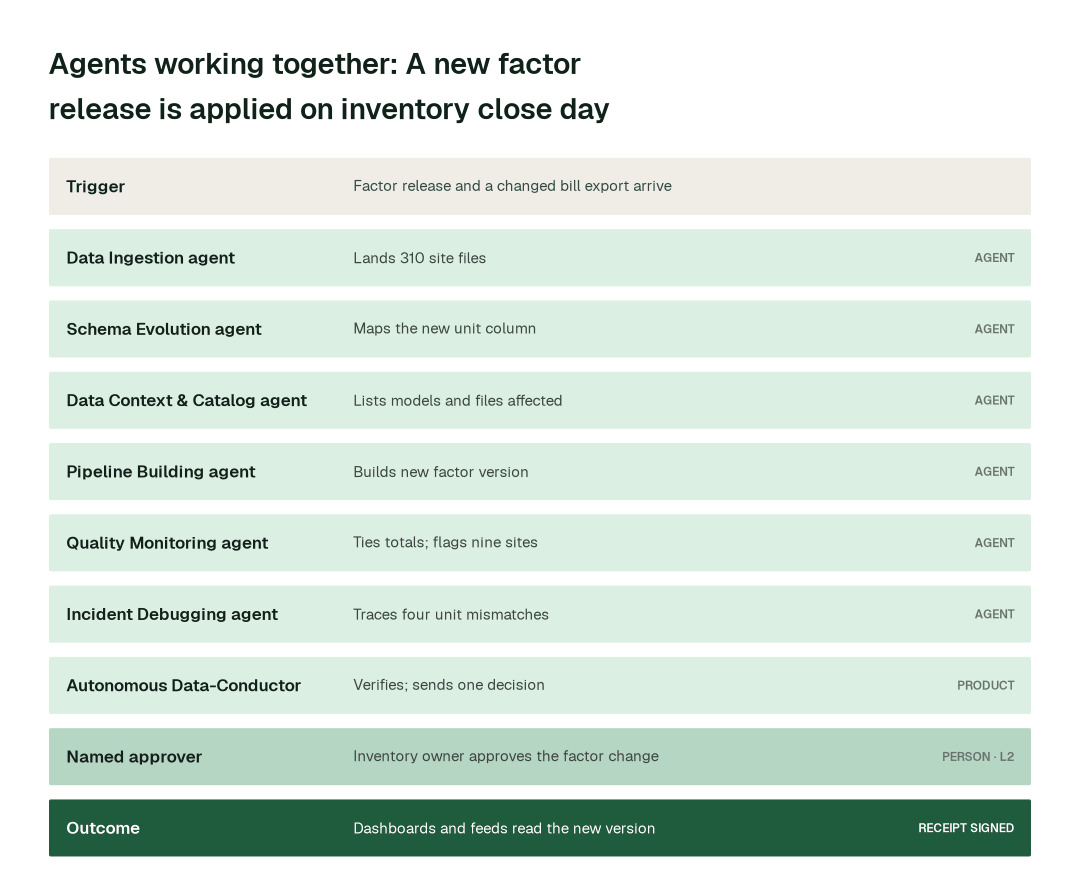
The seven practices below make that week possible. At a glance:
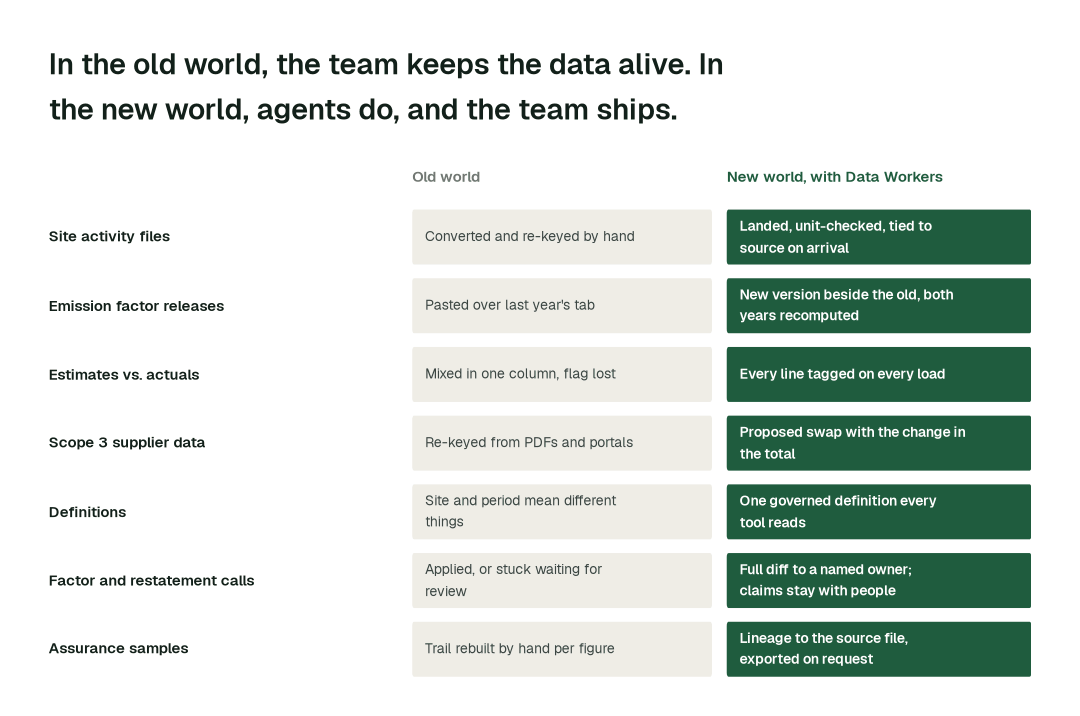
The practices, one by one
1. Land, unit-check and tie every site file on the day it arrives
Activity data arrives as files: monthly bills as spreadsheets and PDFs from hundreds of sites, in different units, periods and layouts. A bad file caught in staging costs minutes; after the report is drafted, a week.
Why it's harder than it looks: A changed file does not fail. A portal that moves from kilowatt-hours to megawatt-hours still produces a column of plausible numbers, and a region that goes missing for a month contributes zero.
- 1.The Data Ingestion agent lands each file and profiles the load (sites, periods, units). The Connectors agent calls
get_connector_statusto confirm every feed arrived. - 2.The Schema Evolution agent runs
detect_schema_changeon each source and maps a changed unit or new template into staging, checking it withvalidate_schema_compatibilitywithrollback_migrationready. - 3.The Quality Monitoring agent ties site totals to the billing source with
run_quality_checkand sets a deadline per feed withset_sla. - 4.Mismatches go to the site owner with the records attached. The inventory owner approves any mapping that changes a number already reported.
The Scope 1 to 3 emissions data use case has the full workflow, and data mapping techniques the engineering view.
2. Version emission factors beside the old ones, never over them
A new grid or fuel factor set lands mid-year. The inventory has to say which factors were used for which period, and reproduce any year on the factors in force when it was reported.
Why it's harder than it looks: The factor library is a tab feeding a dozen models, and overwriting it is the easy path. Afterwards last year's number cannot be rebuilt, and the movement in the total mixes a method change with a business change. The GHG Protocol Scope 2 Guidance asks for location-based and market-based Scope 2 to be accounted for side by side, so the mart carries both.
- 1.The Data Context & Catalog agent runs
blast_radius_analysisand lists every model, dashboard, tracker and outgoing file that reads the factors. - 2.The Pipeline Building agent builds the new set as a version beside the old, recomputes the current and prior year on both, and writes tests, checked with
validate_pipeline, proving the old version still reproduces the published totals. - 3.The Quality Monitoring agent reports the movement by scope, category and site with
get_quality_summary. - 4.The inventory owner approves the new version for the working inventory in one decision, with the full diff in front of them.
Across the routine work, here is the difference in elapsed time:
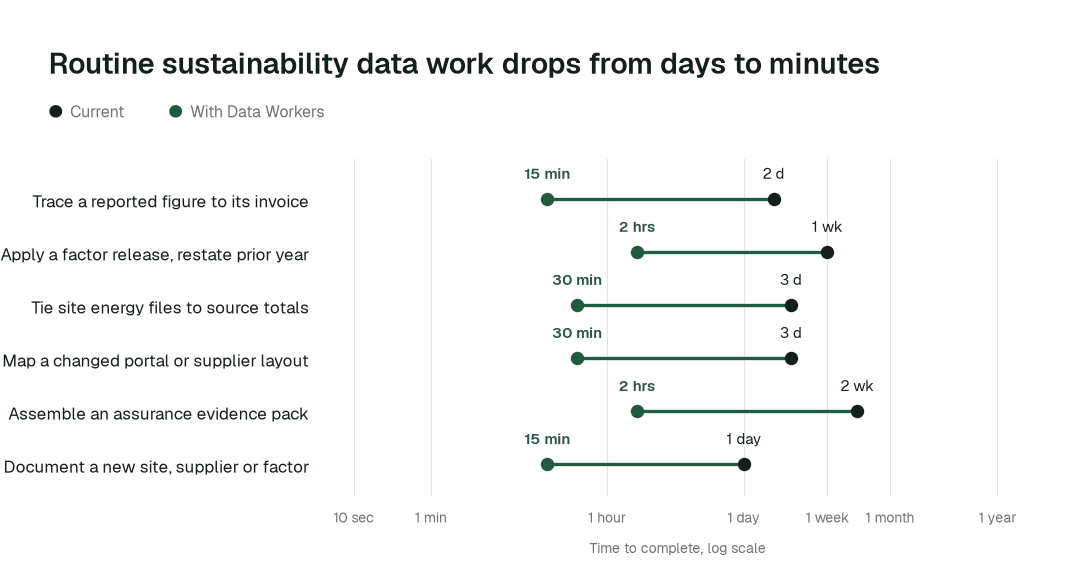
The biggest change is the assurance evidence pack: from about two weeks to 2 hours.
3. Flag every line as measured or estimated, on every load
A missed bill is estimated from last year, and a spend-based figure stands in for a silent supplier. Both are legitimate, and both must stay visible, because the measured share of the inventory is a number reviewers depend on.
Why it's harder than it looks: The flag lives in a column, and the column is lost the first time someone aggregates or re-keys. Estimates also look like actuals: a bill carried forward repeats last year's reading, and nobody scanning 310 sites notices that five are identical month after month.
- 1.The Quality Monitoring agent calls
get_anomalieson every load to find sites whose readings repeat or depart from their normal pattern, and tags each line as measured, estimated or modelled. - 2.The Data Context & Catalog agent records the tag as a governed attribute with
define_business_rule, so it travels through every transformation. - 3.The Incident Debugging agent runs
get_root_causeon flagged sites and names the likely cause, so site owners can request actual readings. - 4.When an actual replaces an estimate, the change is proposed with its effect on the total, and the inventory owner approves.
4. Replace Scope 3 estimates with supplier data through a reviewed swap
Purchased goods and services is the largest category for many companies, and most of it starts as spend multiplied by a factor. Supplier-specific data is better; the GHG Protocol Scope 3 Standard sets out the categories it feeds.
Why it's harder than it looks: Supplier data comes in questionnaires, portals and emails with inconsistent boundaries and periods. A figure for a narrower boundary than the spend it replaces is not a like-for-like swap, and a change of method moves a published number.
- 1.The Connectors and Data Ingestion agents land the supplier files and profile each load.
- 2.The Data Context & Catalog agent maps supplier, spend category and period to the keys the purchase ledger uses, using
auto_tag_datasetandget_lineage. - 3.The Quality Monitoring agent checks each supplier figure against the spend it should explain, flagging mismatched periods and implausible values.
- 4.The agents propose the swap with the change in the total and the data behind it. The inventory owner approves.
The supplier ESG data use case goes deeper.
5. Govern one definition of site, period and boundary before AI answers questions
Sustainability, finance and procurement each have a version of "site", "spend" and "reporting period", and assistants that answer footprint questions will expose the differences.
Why it's harder than it looks: The terms feel obvious until location-based and market-based figures are both called "electricity emissions", or an acquired site sits in one boundary for finance and another for sustainability.
- 1.The Data Context & Catalog agent catalogs each term with
resolve_metricanddefine_business_ruleand marks the certified source withmark_authoritative. - 2.Data Context Wizard holds the governed definitions with provenance, and dashboards, the feed to the sustainability software and every assistant answer from them.
- 3.The Quality Monitoring agent checks that answers agree with the certified numbers.
- 4.A change to a definition is proposed with its blast radius, and the inventory owner approves it.
6. Hold factor choices, restatements and claims for a named person
Three decisions are not the data team's to automate: which factors and method the company uses, whether a published figure is restated, and whether a claim against a target is true.
Why it's harder than it looks: Either every change waits for review and the team becomes the bottleneck, or changes go straight to the mart and the first sign is a restated number in a report. A boundary change or an acquisition also raises a base-year recalculation question under the GHG Protocol Corporate Standard, which is a judgment, not a transformation.
- 1.The agents prepare every proposal with the full diff by scope and category, the blast radius and the rollback.
- 2.The Data Access & Governance agent routes it with
request_governance_review: to the inventory owner for factors and methods, and to the inventory owner and sustainability controller together for restated comparatives. - 3.Unanswered requests expire and escalate; nothing applies by default.
- 4.The decision to restate and every target claim stay with people. The agents prepare the evidence; the named approver decides.
That balance, autonomy where work is reversible and a named approver where a number moves, looks like this by task class:
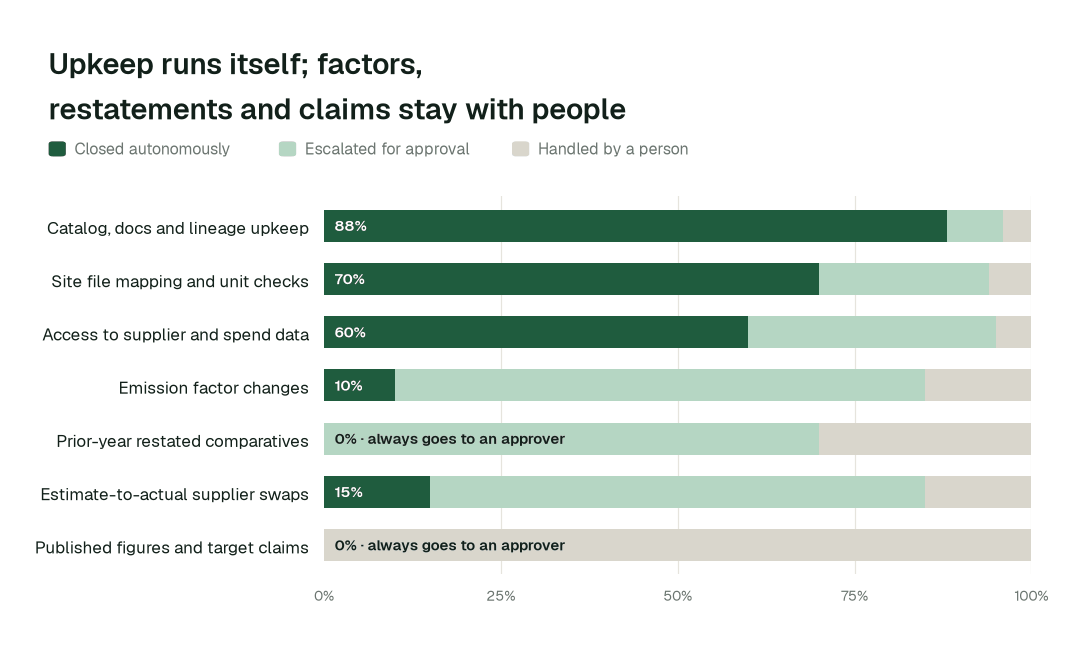
Catalog, docs and lineage upkeep closes autonomously 88% of the time. For published figures and target claims, autonomous closure is 0% by design.
7. Keep lineage from every figure to its source, so an assurance sample is an export
The assurance provider selects a sample and asks for the calculation, the factor and version, the activity data and the source document.
Why it's harder than it looks: Lineage reconstructed per sample does not exist between samples. A figure passes through a dashboard, a model, a spreadsheet a site emailed in March and an invoice in a shared drive, each held by a different person.
- 1.The Data Context & Catalog agent traces the figure with
trace_cross_platform_lineageback to the file it came from. See automated data lineage. - 2.The Quality Monitoring agent attaches the checks that ran, including estimate flags, through
get_quality_summary. - 3.The Data Access & Governance agent compiles the tamper-evident audit trail with
generate_audit_report: what changed, who approved it and when. Audit trail requirements for data agents sets out what it should contain. - 4.The sustainability controller reviews the pack before it goes to the provider.
The audit-ready sustainability reporting use case walks through a sample end to end. Whether the invoice itself is complete is for your controls and assurance provider.
Designing the autonomy ladder
Autonomy is set per task class, not per tool. L0 is manual, L1 observes, L2 proposes, L3 acts reversibly and L4 runs on its own (the levels in full). Every deployment starts at L1. L0 to L2 run today; L3 and L4 are where a domain can go on evidence, never on a date.
| Task class | L0 | L1 | L2 | L3 | L4 |
|---|---|---|---|---|---|
| Site file mapping and unit checks | Today | Today | Today | On evidence | Not set |
| Catalog, docs and lineage upkeep | Today | Today | Today | On evidence | On evidence |
| Estimate and repeating-reading flags | Today | Today | Today | On evidence | Not set |
| Emission factor versions and methods | Today | Today | Ceiling | Never | Never |
| Supplier swaps and restated comparatives | Today | Today | Ceiling | Never | Never |
| Published figures and target claims | Today | People only | People only | Never | Never |
"On evidence" means the receipts for that class are clean and the domain owner chooses to raise the level. A wrong mapping is reversible because the previous mapping and factor version are kept; see how to roll back an agent's change.
The operating model: who owns what
Agents change who does the work, not who is accountable for it:
| Role | Owns | What the agents take off their plate |
|---|---|---|
| Head of Sustainability Data | Standards, autonomy per domain, which scope or region goes next | Assembling status, chasing site owners, keeping the catalog current |
| Inventory owner and sustainability controller | Factor versions, methods, boundaries, restatements, published figures | Preparing the diff, tie-out and rollback plan for every proposal |
| Data and analytics engineers | Reviewing proposals, building coverage and decarbonization analytics | Mapping portal and supplier layouts, writing tie-out tests, tracing a moved total |
The swarm behind the practices
No single agent delivers these practices. Each is a hand-off between specialists, coordinated under the autonomy you set per domain.
| Agent | What it does on sustainability data | Public tools |
|---|---|---|
| Connectors and Data Ingestion | Land bill, fuel, travel, spend and supplier files and profile every load | get_connector_status |
| Schema Evolution | Maps portal layout, unit and supplier template changes | detect_schema_change, rollback_migration |
| Pipeline Building | Builds and versions the activity, factor and inventory models, with tests | generate_pipeline, validate_pipeline |
| Quality Monitoring | Ties totals to billing, flags estimated and repeating readings | run_quality_check, get_anomalies, set_sla |
| Incident Debugging | Traces a moved total to the file, unit, factor or boundary change | get_root_cause, diagnose_incident |
| Data Access & Governance | Scopes supplier and spend data to roles, routes reviews, compiles the audit trail | request_governance_review, generate_audit_report |
| Data Context & Catalog | Keeps data products documented with owner and lineage, and traces a figure to its source | trace_cross_platform_lineage, blast_radius_analysis |
| Cost Savings & Data Cleanup | Retires duplicate extracts, stale factor tabs and abandoned workbooks | detect_dead_assets |
Data Context Wizard keeps the governed definitions, so the number in the report and the number in an assistant's answer never disagree. Autonomous Data-Conductor verifies the numbers that matter before the report is drafted and before any outgoing file is sent. Spellbook Data Catalog (in preview) makes each sustainability data product discoverable in plain English.
What disappears
The clearest sign the practices are working is what stops happening:
- •The factor tab pasted over last year's, with no record of which version a number used.
- •The silent unit change that surfaces as a regional total off by a thousand.
- •Estimates indistinguishable from actuals when the assurance provider asks.
- •The week of re-keying supplier actuals one line at a time.
- •Rebuilding the trail from scratch for every assurance sample.
The point is not any single agent. It is that the back office keeps running: bad data is caught where it enters, every new site, supplier and factor appears documented with an owner, and every action leaves a signed receipt, so the team can see what happened and reverse it.
A Head of Sustainability Data's scorecard
These are targets, set against a baseline you measure first:
- •Reported figure traced to its source invoice: from about two days to 15 min
- •New factor release applied with the prior year restated: from about a week to 2 hours
- •Site energy files tied to source totals: from about three days to 30 min
- •Share of the inventory measured versus estimated: known every month
- •Assurance samples answered from an export: every one
- •Catalog and docs upkeep closed autonomously: targeting 88% as the deployment matures
- •Factor, method and restatement changes with a named approver on record: 100%
Where this goes next
Once Scope 1 and 2 site data runs this way, the constraint becomes coverage. Scope 3 supplier data is the next mission, and the disclosure feeds follow: the datapoints in the CSRD and ISSB disclosure data use case are drawn from the same certified tables.
The climb: from assisted to autonomous to agentic
Our thesis is that the data platform climbs the way analytics did, in stages, and that the hard part of data work was never knowing what to do but doing it. For sustainability data teams, the climb looks like this:
- •Assisted. Agents work alongside your team. They read the whole stack, show what needs doing and propose every fix with a receipt; factors, methods, comparatives and published figures always go to a named owner.
- •Autonomous, under your governance. Routine work runs on its own: site files are landed and tied to their source on arrival, estimated readings are flagged on every load and layout changes in portal and supplier files are mapped the day they happen. Your team governs the agents instead of doing the upkeep.
- •The agentic enterprise. A sustainability data team that ships coverage, supplier data quality and decarbonization analytics instead of rebuilding the inventory. People set direction, and the platform carries it out.
You choose the altitude, every step is visible and reversible, and the pilot below is the first rung.
The pilot: how sustainability data teams start
The pilot is how your team proves the value on its own data before committing. For the wider set of teams in this area, see the ESG and sustainability data teams landing page.
- •What we connect. Your utility-bill and fuel exports, the factor library, Snowflake or Databricks, dbt, Airflow or Dagster, and Tableau or Looker, over MCP, inside your infrastructure. Nothing migrates.
- •Scope. Scope 1 and 2 site activity data and the annual factor update, as a mission at L2.
- •First week. Agents run at L1 across the scoped domain. They map every pipeline, definition and lineage path and show the fixes they would have made, with receipts, so your team sees the value before anything changes.
- •By week two. Site files tied to source totals on arrival and estimated readings flagged on every load start running on reversible work. Factors, methods and comparatives stay at L2 with a named approver.
- •At day 30. We review the impact metrics against your baseline:
- •Reported figure traced to its source invoice: from about two days to 15 min
- •New factor release applied with the prior year restated: from about a week to 2 hours
- •Site energy files tied to source totals: from about three days to 30 min
- •the share of catalog and docs upkeep closed autonomously, targeting 88% as the deployment matures
- •What you decide. Whether to expand to Scope 3 supplier data or the disclosure feeds. The pilot fee is credited in full against the first year.
- •The guarantee. In a 90-day pilot, ten engineering hours per data engineer per week are recovered against a baseline both sides sign on day one, or the $7,500 fee is refunded.
- •Cost. Start with a pilot ($7,500 one-time, credited in full against the first year). Scale is from $1,000 a month and Enterprise from $3,000 a month, billed annually, with unlimited seats, no usage meter and no markup on model spend. See pricing.
The pilot is the start of a longer curve:
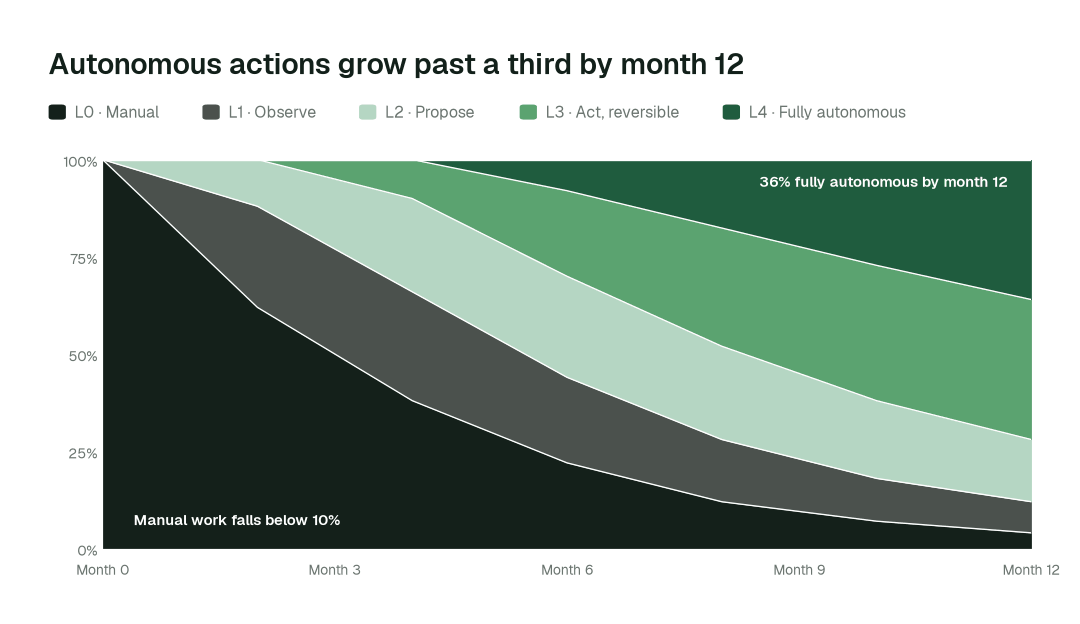
By month 12, more than 36% of agent actions run fully autonomously and manual work falls below 10%, while factors, methods, restatements and target claims stay with a named owner.