How healthcare analytics and data mart teams go fully agentic and autonomous
Going fully agentic and autonomous does not mean putting a chatbot on top of patient data. For the healthcare analytics and data mart teams at health systems, hospitals and provider groups, it means climbing from agents that assist, to agents that keep the marts, measures and dashboards current under your governance, to an analytics back office that largely runs itself: tracing an Epic upgrade to every measure it touches, tying finance and quality to one definition, scoping access to the minimum necessary and leaving the evidence behind, while named owners decide who sees PHI and what goes to a regulator. This is what that climb looks like, step by step.
Key takeaways
- •Who this is for. The analytics team that runs the enterprise data warehouse and the marts on top of it at a health system, hospital or provider group: quality measures, operational dashboards, service-line finance and regulatory submissions.
- •The problem today. An Epic upgrade renames a Clarity column and a measure quietly changes. CMS publishes new measure specifications and the marts are rebuilt by hand. Finance and quality report different discharge counts in the same board meeting. The report request queue is weeks long, and every table holds PHI.
- •What changes. Every upgrade, feed change and specification change is traced to the marts, measures and dashboards it touches before the next refresh. Finance and quality read one governed definition, with the differences documented. Routine report requests are answered from those definitions.
- •What stays with your people. Who sees PHI, what counts as the minimum necessary, changes to measure logic, and every measure submission or file sent to a regulator. Each has a named owner who approves it with the evidence in front of them.
- •The result. An analytics team that spends its week building the next service-line view and the next improvement project instead of re-explaining last quarter's numbers.
The PRD for agentic healthcare analytics and data mart teams
This is the requirements document we would write with you for your team. Everything below expands on it.
| Who | Healthcare analytics, enterprise data warehouse, quality measure, service-line finance and regulatory reporting teams at health systems, hospitals and provider groups |
| The job | Measures and marts that survive every upgrade, one number for finance and quality, and a report queue that moves. |
| Environment | Epic Clarity and Caboodle or Oracle Health (Cerner) data; claims and cost-accounting feeds; the enterprise data warehouse and marts in SQL or dbt; a scheduler such as Airflow or the tool you run today; Tableau, Qlik or the BI tool you run; quality measure and registry vendors. |
| Constraints | PHI is in nearly every table, and access follows the minimum necessary standard. Measure logic, abstraction rules and anything submitted to CMS or another regulator go to a named owner. |
| Success is measured by | Clarity change traced to measures: from about 2 days to 30 min; Finance and quality numbers tied: from about 3 days to about 1 h; Annual measure spec update: from about 2 weeks to about a day; mart docs and lineage upkeep closed autonomously 88% of the time. |
| Owned by | A Director of Healthcare Analytics, with the quality measure owner, the privacy officer and the finance lead as named approvers. |
| Pilot scope | A Clarity upgrade and the annual measure refresh for the quality marts at L2. |
What going fully agentic and autonomous means for healthcare analytics and data mart teams
- •Put your data pipeline on autopilot. Clarity and Caboodle changes, new feeds and measure specification updates are mapped into the marts before the next refresh, so an upgrade weekend does not turn into a week of broken dashboards.
- •Run the data back office without the busywork. The work that fills the week today moves to agents: tracing which measures an upgrade touched, working out why two reports disagree, keeping mart documentation current and answering the same report requests again.
- •Scale data without scaling headcount. New service lines, new facilities after an acquisition and new measure programs arrive without the analytics team growing with them, because tie-outs, access checks and documentation run on their own.
- •Get the plumbing off your plate. An analytics team that builds the next service-line view and the next improvement project instead of rebuilding marts after every upgrade and defending last quarter's numbers.
Who this is for
The analytics layer of a health system. This playbook is for the people who sit on top of the electronic health record extraction and turn it into numbers that leadership, clinicians, finance and regulators act on. At a health system that is usually the enterprise analytics or data warehouse group; at a hospital or provider group it may be a handful of analysts and a data engineer. They own the marts for quality and safety, operations and patient flow, service-line finance and the regulatory and accreditation submissions.
The titles: Director of Healthcare Analytics, Manager of Enterprise Data Warehouse, Quality Analytics Lead, Clinical Informatics Analyst, Data Mart Architect and Regulatory Reporting Analyst.
This is a different job from the one in our clinical and EHR data playbook, which is about getting data out of the record and into a usable warehouse. This playbook starts after that: the measure definitions, the marts, the dashboards and the queue of report requests. If your team also owns the extraction, read both. For the neighbouring teams, see revenue cycle analytics, population health and value-based care data, provider data management and claims and payer data. The whole health and life sciences group is on one page, including genomics, imaging and multi-omics data and pharmacy benefits data.
The product you ship
- •Quality and safety marts: the encounters, diagnoses, procedures, results and medications behind electronic clinical quality measures, hospital-acquired condition tracking and registry feeds, with the measure logic versioned by reporting year.
- •Operational marts: throughput, length of stay, bed and operating room utilization, emergency department flow and staffing against volume. See capacity and patient flow.
- •Service-line finance: volumes, revenue and cost by service line and facility, built from the cost accounting system and the patient accounting feed, tied to the general ledger.
- •Regulatory and accreditation submissions: the measure files sent to CMS and its contractors, state reporting and accreditation data requests.
- •Dashboards and standard reports: the executive, department and unit views, and the extracts that other teams pull.
- •The report request queue: the ad hoc questions from clinical leaders, finance, research and operations that do not fit a dashboard yet.
Where the week goes
- •Upgrades change the source. A new Epic version adds, renames or retires Clarity tables and columns, and every mart built on them has to be checked before anyone trusts Monday's dashboards.
- •Measure specifications change every year. CMS and the measure developers update electronic clinical quality measure (eCQM) specifications, value sets and logic for each reporting period, and the team has to see exactly what changed in its own data.
- •Definitions are contested. Finance counts a discharge one way, quality another and operations a third, and the same board slide carries all three.
- •The report request queue never empties. Many requests are the same question with a different date range or unit, and each waits for an analyst who knows where the data is.
- •PHI is in every table. Each mart, extract and ad hoc pull needs access scoped to the minimum necessary, and someone has to be able to show who saw what.
- •Submissions have deadlines and no slack. Measure files go to a regulator on a fixed calendar, and the evidence behind them is assembled by hand.
- •Documentation is always behind. The mart that explains a measure is last year's, and the person who built it has moved on.
Add it up and upkeep is most of the team's week. Here is how a typical week splits today, and once agents own the back office:
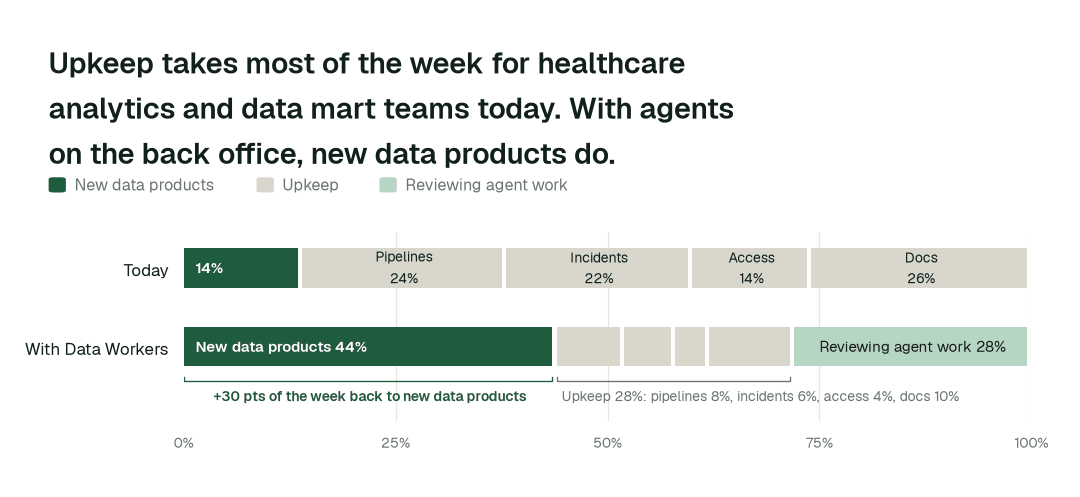
Time spent on new data products moves from 14% of the week to 44%. Most of the rest becomes review: people steer and approve agent work instead of doing it by hand.
Then and now
| Work | Today | With Data Workers |
|---|---|---|
| Epic upgrade | Marts checked by hand after go-live | Affected marts and measures listed before the refresh |
| Annual measure specifications | Rebuilt by hand, differences found late | Old and new logic run side by side on your encounters |
| Finance vs quality numbers | Argued in the meeting | Tied to the same encounters, differences documented |
| Report requests | Queued for an analyst | Answered from governed definitions, odd ones routed with context |
| Access to PHI | Granted by ticket, reviewed once a year | Scoped to the minimum necessary, every grant logged |
| Mart documentation | Last year's | Updated as the data changes |
These are the impact metrics we move for healthcare analytics and data mart teams:
- •Clarity change traced to measures: from about 2 days to 30 min
- •Finance and quality numbers tied: from about 3 days to about 1 h
- •Annual measure spec update: from about 2 weeks to about a day
Across the routine work in this domain:
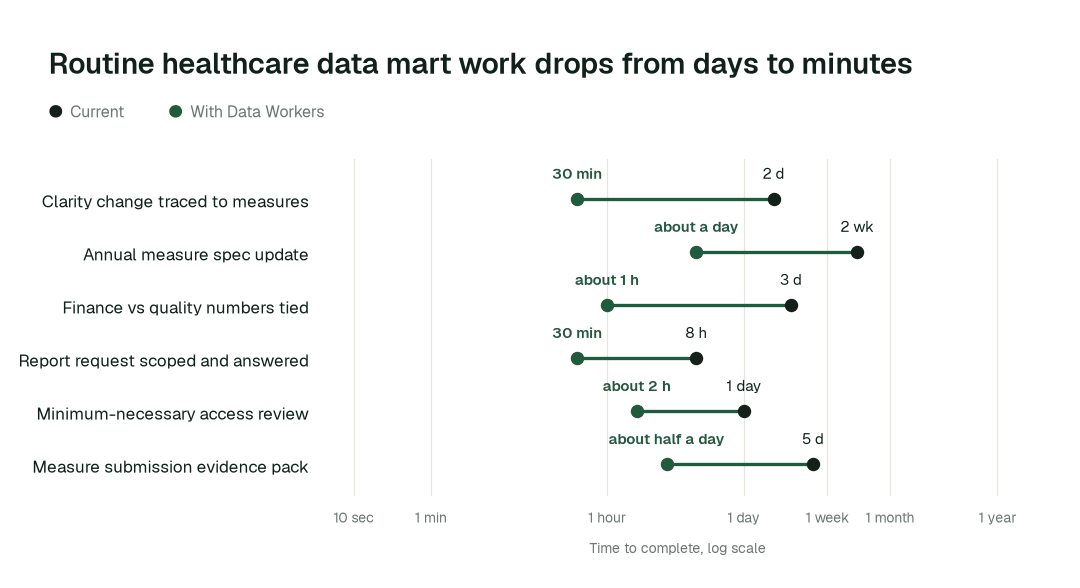
The biggest change is the annual measure spec update: from about 2 weeks to about a day. Work that waited in queues finishes in minutes or hours, because agents detect, fix and verify in one pass and leave the before-and-after for the person who owns the measure.
Use cases, in depth
An Epic upgrade stops breaking the quality marts
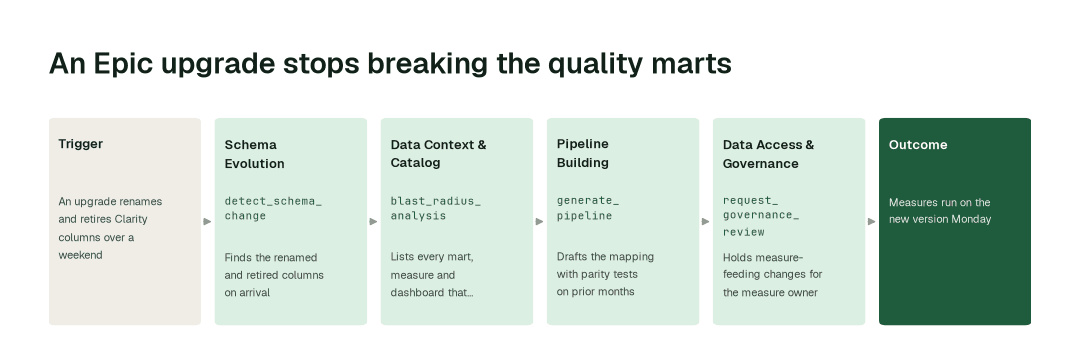
Today. The upgrade goes live, a nightly job fails or, worse, succeeds with a column that now means something slightly different. Analysts find out when a quality dashboard looks wrong, then trace it back by hand through the staging models to the measure.
With Data Workers. Schema Evolution finds the renamed and retired Clarity columns when they first arrive. Data Context & Catalog lists every mart, measure and dashboard that reads them. Pipeline Building drafts the mapping with parity tests against prior months. Anything that feeds a measure is held for the measure owner.
What changes. The measures run on the new version on Monday, with a record of what moved.
Finance and quality stop publishing different discharge counts
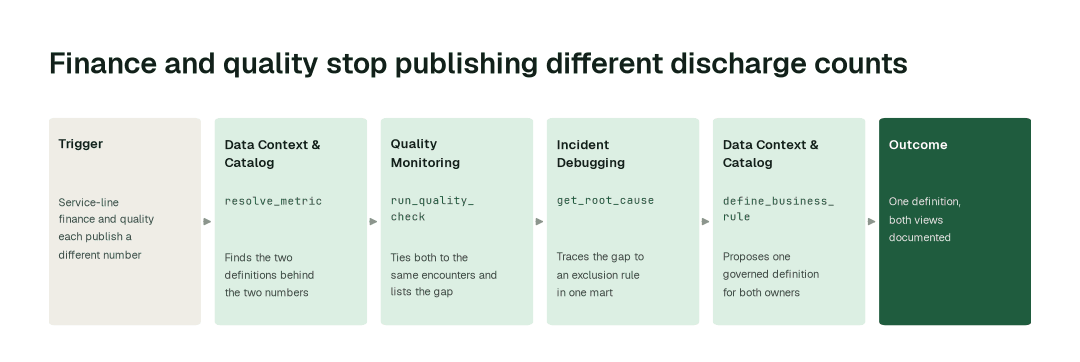
Today. Service-line finance counts discharges from the patient accounting feed, quality counts them from the encounter, and the two differ by a few percent for reasons nobody can name without a day of digging.
With Data Workers. Data Context & Catalog finds the two definitions, Quality Monitoring ties both to the same encounters and lists the gap, and Incident Debugging traces it to the rule that causes it, such as an exclusion in one mart. The agents propose one governed definition and document the legitimate differences for both owners.
What changes. Finance and quality can both stand behind their numbers, and the difference is a documented decision, not a surprise. The same approach underlies our work on cost of care.
A report request queue that moves, with PHI scoped
Today. A department chair asks for readmissions by unit for the last two years. An analyst finds the right table, works out which definition applies, writes the query, checks the access and sends an extract. The next request is the same question for a different unit.
With Data Workers. The request is answered from the governed definitions and the authoritative tables, with the source shown. Data Access & Governance checks the request against the requester's role and the minimum necessary standard before anything is returned. Requests that need a new definition, a new data source or access beyond the requester's role are routed to an analyst with the context already gathered.
What changes. Analysts spend their time on the questions that need an analyst. See also our clinical quality use case.
Measure the product, not just the pipeline
Analytics leaders are judged on whether the numbers are trusted and used, not on how many tables the warehouse holds. The Autopilot dashboard shows how much of each mart's upkeep runs on its own, and adoption reporting shows which dashboards and extracts are used and which no longer are, so the team can show leadership where its time now goes and retire what nobody reads.
Agents working together: The week the new measure specifications land
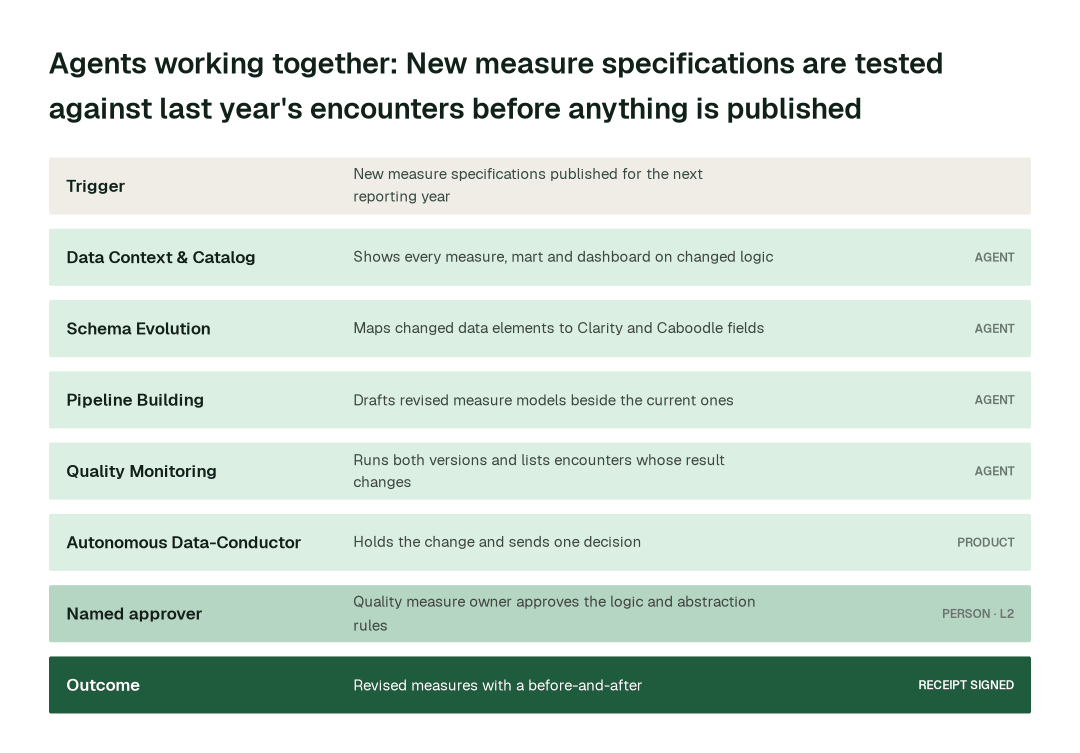
Every quality analytics team knows this week. The updated electronic clinical quality measure specifications and value sets arrive for the next reporting year. Some logic is the same, some changes, and a few measures are retired or added. The team has to find out what changed, what it does to the health system's own results and which dashboards, registry feeds and board scorecards depend on it, before the first reporting window and without disturbing this year's numbers. This is the same week run by Data Workers.
The setup
The quality marts are built in SQL and dbt on the enterprise warehouse, fed from Clarity and Caboodle, and refreshed nightly. They feed a quality scorecard, unit-level dashboards and the extract that goes to the regulatory submission vendor. Autonomy in Autopilot:
- •Mart documentation and lineage upkeep: L2 today; a candidate for L3 on evidence.
- •Mapping source changes into staging: L2 today, a candidate for L3 on evidence; measure-feeding fields stay at L2.
- •Measure logic, abstraction rules and submissions: L2 for logic, L0 for submissions.
The team scheduled one mission a week earlier: "Prepare the quality marts for the new measure year with a side-by-side on last year's encounters."
06:00, the specifications arrive
The quality analytics lead drops the updated specifications and value sets into the project. Nothing changes in production.
06:05, find what is touched
Data Context & Catalog agent lists every measure model, mart, dashboard and extract that depends on a changed measure, a changed value set or a retired one, and shows the lineage from each back to the Clarity and Caboodle fields it reads. In this illustrative example, eleven measure models are affected, three dashboards and one registry feed.
06:20, map the data elements
Schema Evolution agent compares the data elements the new specifications need with what the warehouse holds. Two elements map cleanly to existing fields, one needs a new Caboodle field that the build has not yet landed, and one value set adds codes the staging model does not recognise.
06:45, draft the revised models
Pipeline Building agent drafts revised measure models next to the current ones rather than replacing them, with tests that prove the unchanged measures still match last year's results. The draft is validated against the warehouse before anyone looks at it.
07:30, run both versions
Quality Monitoring agent runs the old and the new logic on last year's encounters and reports, per measure, how many encounters change numerator or denominator status and why. It also flags three encounters where a value-set change moves a result in the opposite direction from what the measure developer's notes would suggest, for a person to look at. The list shows encounter identifiers inside your environment, not patient detail in a chat.
08:00, trace what does not tie
Incident Debugging agent traces the odd results to a local mapping that was added for a legacy code and is now duplicated by the new value set. It proposes removing the local mapping and lists the two measures that depend on it.
08:20, hold the decision
Autonomous Data-Conductor checks that the revised models run on the test period, that unchanged measures match last year, and that no dashboard or extract reads a model that is about to change without an updated version. Because measure logic sits at L2, Conductor sends one decision to the quality measure owner: the specification diff, the side-by-side results, the encounters that move and the proposed removal of the local mapping.
10:15, approved
The measure owner approves the logic for nine measures, asks for a second look at the local mapping with the abstraction team and holds two measures until the new Caboodle field lands. Conductor applies the approved changes to the test environment and the production release waits for the usual change process.
What stays behind
- •Revised measure models with tests, beside the current ones, ready for the next reporting window.
- •A side-by-side of old and new logic on your own encounters, one line per measure.
- •A receipt for every change: who proposed it, who approved it and how to roll it back.
- •Updated Spellbook pages for every affected mart, measure and dashboard.
- •A reusable mission. Next year's specification update runs the same way, and the team can move the routine parts to L3.
Minute by minute
This is an illustrative example. The quality marts run in SQL and dbt on the enterprise warehouse, refreshed nightly from Clarity and Caboodle. Measure logic is at L2 and submissions are at L0.
| Time | Who | What happens |
|---|---|---|
| 06:00 | Quality analytics lead | New measure specifications and value sets added to the project |
| 06:05 | Data Context & Catalog agent | trace_cross_platform_lineage lists the affected models, dashboards and feed |
| 06:20 | Schema Evolution agent | assess_impact maps new data elements to Clarity and Caboodle fields |
| 06:45 | Pipeline Building agent | Revised models drafted beside current ones; validate_pipeline passes |
| 07:30 | Quality Monitoring agent | run_quality_check compares old and new results on last year's encounters |
| 08:00 | Incident Debugging agent | diagnose_incident traces odd results to a duplicated local mapping |
| 08:20 | Spellbook Data Catalog | Logic held at L2 with the full diff |
| 10:15 | Spellbook Data Catalog | Measure owner approves nine measures and holds two |
The agents on the job
| Agent | What it does on a healthcare analytics and data mart team | Tools it calls |
|---|---|---|
| Connectors and Data Ingestion | Land Clarity, Caboodle, claims, cost accounting and registry feeds, and profile every load | get_connector_status, get_dbt_run_history, get_dbt_test_results |
| Schema Evolution | Maps Epic upgrade changes, new fields and specification data elements into the marts | detect_schema_change, assess_impact, validate_schema_compatibility, generate_migration, rollback_migration |
| Pipeline Building | Builds and versions measure and mart models in SQL or dbt, with parity tests | generate_pipeline, validate_pipeline, deploy_pipeline |
| Quality Monitoring | Ties finance to quality, marts to source and measures to last year, every day | set_sla, run_quality_check, get_anomalies, create_quality_tests_for_pipeline |
| Incident Debugging | Traces a discrepancy between two numbers to the change that caused it | diagnose_incident, get_root_cause, get_incident_history |
| Data Access & Governance | Scopes access to the minimum necessary, finds PHI in new tables and logs every grant | scan_pii, check_policy, enforce_rbac, provision_access, generate_audit_report |
| Data Context & Catalog | Keeps every mart, measure and dashboard documented with owner, lineage and consumers | trace_cross_platform_lineage, blast_radius_analysis, resolve_metric, define_business_rule, generate_documentation |
| Usage Intelligence | Shows which dashboards and extracts are used and which can be retired | get_adoption_dashboard, get_cost_enrichment |
Data Context Wizard holds one governed definition of a discharge, a readmission, a case, a service line and every measure population, with where each came from. Dashboards, extracts and every agent that answers a report request read the same definitions, so the answer and the board slide do not disagree. Data Science & Insights answers routine questions through those definitions. Autonomous Data-Conductor verifies the numbers that matter before they are published. Spellbook Data Catalog makes each mart discoverable to analysts, clinicians and finance in plain English, and is in preview on the Enterprise tier.
What goes on autopilot
Once a domain has earned it, this work runs on its own, and each item removes a problem your team deals with today:
- •Source changes are mapped into the marts the day they arrive, so an upgrade weekend does not break Monday's dashboards.
- •Finance and quality are tied to the same encounters every morning, so the board slide stops carrying two numbers for one thing.
- •Mart documentation, lineage and owners are kept current, so the person who inherits a measure can see how it is built.
- •Unused dashboards and extracts are found and proposed for retirement, with the downstream check done first.
Where your people stay in charge
Agents never get blanket access. Each domain has its own autonomy level, set by you, and it only rises when the receipts show the agents are reliable. Everything starts at L1, observing only; reversible upkeep such as reruns, staging fixes and documentation is usually first to run on its own.
- •Access to PHI goes to a named owner. The privacy officer or data steward approves any new access to identifiable data, and agents scope access to the minimum necessary, never wider.
- •Measure logic and abstraction rules go to the quality measure owner with a side-by-side on your own encounters.
- •Measure submissions and anything sent to CMS or another regulator stay with the named submitter. Agents prepare the evidence and never send the file.
- •Clinical interpretation stays with clinicians. Agents show that a result moved and why in the data; they do not decide what it means for care.
Once a deployment has matured, here is how that ladder plays out across task classes:
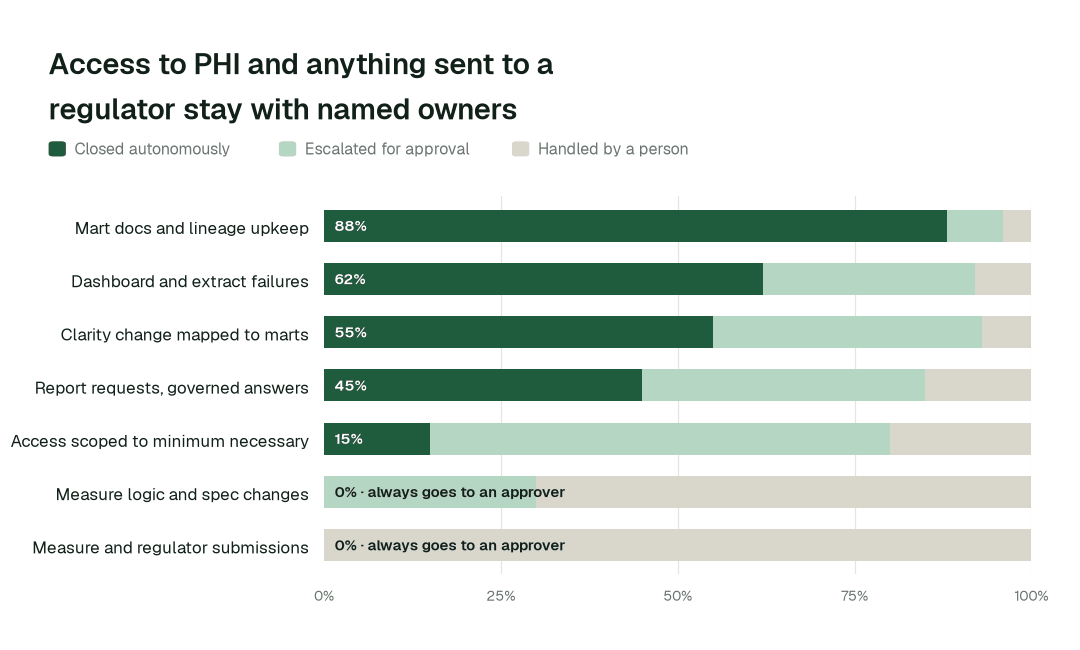
Mart docs and lineage upkeep closes autonomously 88% of the time. For measure and regulator submissions, autonomous closure is 0% by design: the evidence is prepared, and a named person submits it.
What happens when an agent is wrong
- •At L2 propose, nothing changes until a named person approves. The proposal shows the full diff, the blast radius and how to roll it back. Unanswered requests expire and escalate.
- •L3 and L4 are where a domain can go next, on its own review record: acting on its own, with a rollback point on every change. Only the domain's owner raises its level, and if people start reverting the agents' changes, the domain pauses itself.
- •No agent approves or promotes its own work. Autonomy only grows on evidence, domain by domain, and repeated reverts pause the domain.
- •One org-wide stop halts all autonomous dispatch, and every action lands in a tamper-evident audit trail you can export with
generate_audit_report.
How it fits your stack
Data Workers connects to what you already run: Epic Clarity and Caboodle or Oracle Health data, claims and cost-accounting feeds, the enterprise warehouse and marts, your SQL or dbt project, your scheduler and the BI tool your analysts use. Each agent is an MCP server, so the same agents work inside Claude Code, Cursor or Codex and in Slack through Spellbook. Nothing migrates.
- •Runs in your environment with your credentials and your model key: your cloud, your VPC or on-premises on the Enterprise tier. With a sovereign setting, every AI call stays on models you host yourself. Sensitive-data scanning never sends sample values outside your network.
- •Uses the access you already govern. Agents act under scoped service identities and your existing roles; every grant goes through
provision_accessand is logged. - •Proposes changes as diffs in your SQL or dbt project, your scheduler and your warehouse, with blast radius, tests and a rollback point, and applies them only at the autonomy level you set for that domain.
- •Open-source core. The Apache-2.0 community edition ships 11 agents and 160+ MCP tools, so your engineers can read exactly what the agents call.
Governance and regulation
Two things matter most here. The HIPAA Privacy Rule's minimum necessary standard expects that uses and disclosures of PHI are limited to what the purpose needs, and the Security Rule expects access controls and audit controls on systems holding electronic PHI. Quality reporting adds the calendar and rules of the programs you report to, such as the CMS Hospital Inpatient Quality Reporting Program, which uses electronic clinical quality measures whose specifications are updated for each reporting period and published through the eCQI Resource Center.
Data Workers scopes access with enforce_rbac and provision_access, checks requests with check_policy, finds PHI in new tables with scan_pii, holds measure-affecting changes for a named owner and records every action in a tamper-evident trail. Every grant, every measure change and every file prepared for submission has a named approver and a record.
Data Workers doesn't make you compliant; your controls, people and assessors do. It supplies controls and evidence wherever agents touch data. Not legal advice. For the technical safeguards in more detail, see our guide to HIPAA data governance automation and data governance for healthcare.
The alternatives healthcare analytics and data mart teams weigh
Build it yourselves. A strong team can wire a coding agent to MCP servers for the warehouse and dbt. The work is everything around it: routing approvals to the right owner, blast radius, rollback, receipts, minimum-necessary access, and current context about every other system.
EHR vendor reporting and analytics tools. Epic and Oracle Health provide reporting and data models for their own record, and they are the right place for operational reports inside the EHR. This work crosses the EHR, claims, cost accounting and the enterprise warehouse. Data Workers keeps the marts under your dashboards correct across all of them.
Quality measure and registry vendors. They calculate and submit measures. Data Workers does not replace the calculation or the submission: it makes sure the data going in is current and the logic changes are tested and approved.
Observability, catalogs and BI tools. Observability alerts, catalogs document, and BI shows. Data Workers takes their signals, diagnoses, proposes the fix, verifies it and leaves the receipt. For the analyst's side, see Data Workers for data analysts and how the Data Science & Insights Agent takes on routine questions.
In this space specifically. Health system analytics platforms and measure engines report on quality; Data Workers keeps the marts under them correct and the definitions shared.
The case for your CTO
What this replaces. Weeks of re-checking marts after every Epic upgrade, hand-rebuilt measure logic every reporting year, board-meeting arguments over whose number is right and a report queue that holds the same questions on repeat.
What your team gets back. An analytics team that builds the next service-line view and the next improvement project instead of defending last quarter.
Integration effort. Connecting is configuration, not a migration. The agents attach over MCP to the warehouse, SQL or dbt project, scheduler and source feeds you already run, under the roles you already govern, inside your own environment. Your engineers can read every tool the agents call in the open-source core.
Risk and control. Autonomy is set per domain. Everything starts at L1, observing only; reversible work moves up only when the receipts justify it; measure logic stays at L2 with a named approver; PHI access and submissions stay with their owners; and one org-wide stop halts all autonomous work.
Why now. Every analytics team is being asked to put AI on top of the warehouse. An agent that reads a mart whose definition silently changed after an upgrade gives a confident wrong answer about patients.
The first win. A Clarity upgrade and the annual measure refresh for the quality marts at L2. The pilot below lays out the scope, what you see each week and the cost.
The climb: from assisted to autonomous to agentic
Our thesis is that the data platform climbs the way analytics did, in stages, and that the hard part of data work was never knowing what to do but doing it. For healthcare analytics and data mart teams, the climb looks like this:
- •Assisted. Agents work alongside your team. They read the whole stack, show what an upgrade or a specification change touches and propose every fix with a receipt; measure logic, PHI access and submissions always go to a named owner.
- •Autonomous, under your governance. Routine work runs on its own: source changes are mapped into the marts the day they arrive, finance and quality are tied every morning, and mart documentation stays current. Your team governs the agents instead of doing the upkeep.
- •The agentic enterprise. An analytics team that builds the next service-line view and the next improvement project instead of rebuilding marts. People set direction, and the platform carries it out.
You choose the altitude, every step is visible and reversible, and the pilot below is the first rung.
The pilot: how healthcare analytics and data mart teams start
The pilot is how your team proves the value on its own data before committing.
- •What we connect. The warehouse and marts, the SQL or dbt project, the scheduler, the Clarity and Caboodle or Oracle Health extracts and the BI layer you run, over MCP, inside your environment. Nothing migrates.
- •Scope. A Clarity upgrade and the annual measure refresh for the quality marts at L2.
- •First week. Agents run at L1 across the scoped domain. They map every mart, measure definition and lineage path and show the fixes they would have made, with receipts, so your team sees the value before anything changes.
- •By week two. Source changes mapped into the marts and finance-to-quality tie-outs start running on reversible work. Measure logic stays at L2 with a named approver, and PHI access and submissions stay with their owners.
- •At day 30. We review the impact metrics against your baseline:
- •Clarity change traced to measures: from about 2 days to 30 min
- •Finance and quality numbers tied: from about 3 days to about 1 h
- •Annual measure spec update: from about 2 weeks to about a day
- •the share of mart docs and lineage upkeep closed autonomously, targeting 88% as the deployment matures
- •What you decide. Whether to expand to the next domain. The pilot fee is credited in full against the first year.
- •Cost. Start with a pilot ($7,500 one-time, credited in full against the first year). Scale is from $1,000 a month and Enterprise from $3,000 a month, billed annually, with unlimited seats, no usage meter and no markup on model spend. See pricing.
The pilot is the start of a longer curve:
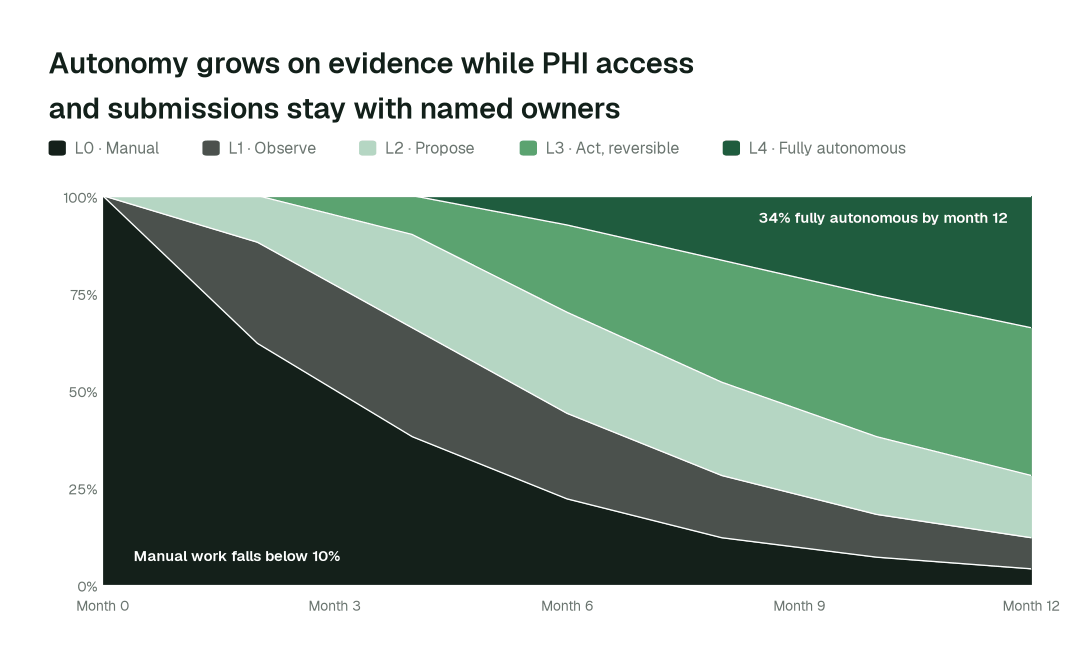
By month 12, more than 34% of agent actions run fully autonomously and manual work falls below 10%, while PHI access and measure submissions stay with their named owners.
FAQ
Does it replace Epic reporting, Clarity or Caboodle? No. Those stay as they are. Data Workers works on the marts, measures and dashboards you build on top of them.
Does it calculate or submit our measures? No. Calculation stays in your measure logic or your measure vendor, and submission stays with the named submitter. Agents test logic changes, tie the numbers and prepare the evidence.
Will agents see PHI? Agents act under scoped service identities and your existing roles, inside your environment, and the privacy officer or data steward approves any new access to identifiable data. Sensitive-data scanning never sends sample values outside your network.
Is it HIPAA compliant? Compliance belongs to your organization's controls, people and assessors. Data Workers supplies access controls, audit evidence and named approvals where agents touch data.
Can it answer report requests directly? Routine ones, from governed definitions with the source shown. Requests that need a new definition or wider access go to an analyst with the context gathered.
Do we have to migrate anything? No. Your warehouse, SQL or dbt project, scheduler, catalog and BI stay where they are.
Sources
- •Data Workers pricing: https://dataworkers.io/pricing/
- •HHS, HIPAA minimum necessary requirement: https://www.hhs.gov/hipaa/for-professionals/privacy/guidance/minimum-necessary-requirement/index.html
- •HHS, HIPAA Security Rule: https://www.hhs.gov/hipaa/for-professionals/security/index.html
- •CMS QualityNet, Hospital Inpatient Quality Reporting Program: https://qualitynet.cms.gov/inpatient/iqr
- •eCQI Resource Center (electronic clinical quality measures): https://ecqi.healthit.gov/