Best practices for agentic healthcare analytics and data marts: a field guide for hospital analytics teams
The marts under a health system's quality scorecards, service-line finance and regulatory files are rebuilt after every Epic upgrade and every measure year, and every table holds PHI. This field guide shows how to run that work with agents, practice by practice: the old world, the new world, who approves what, and the numbers to track. It is written for the analytics leader who has to defend the numbers.
Ask the director of healthcare analytics at a health system what the week looked like and the answer is rarely the roadmap. It is the Epic upgrade that renamed a Clarity column, the quality dashboard that moved overnight, the board slide where finance and quality reported different discharge counts, and the chair who has asked for readmissions by unit, again. The marts on the enterprise warehouse feed quality scorecards, service-line finance and the files that go to CMS.
The mandate is to put trustworthy numbers in front of leaders faster, and now to let AI answer questions on top of the same warehouse. The trap is that, without automation, the team spends its time keeping the marts alive. Definitions drift, documentation goes stale and every table holds PHI.
Our view: the work that keeps a healthcare mart correct is repeatable, and agents should own it. Measure logic, access to identifiable data and anything sent to a regulator belong to named people. When the back office runs itself, the analytics team stops defending last quarter and builds the next service-line view. This is the deep companion to the healthcare analytics playbook.
The old world
It is the Monday after an Epic upgrade weekend. A nightly job succeeded, but a Clarity column now means something slightly different, and the 30-day readmission measure moved. An analyst traces it through the staging models by hand. By afternoon the quality lead is explaining to the CMO why a dashboard changed, while finance and quality prepare different discharge counts for the same board meeting. Three requests in the queue are the same length-of-stay question for different units. Nobody touches the next service-line view this week.
The new world
Same Monday with Data Workers. Schema Evolution flagged the renamed Clarity columns when the upgrade landed in the test environment, and Data Context & Catalog listed every mart, measure and dashboard that reads them. Pipeline Building drafted the mapping with parity tests against prior months. Because the logic feeds a measure, Autonomous Data-Conductor held it for the quality measure owner, who approved it with the side-by-side in front of her. Finance and quality were tied to the same encounters before anyone opened a dashboard, and the queued requests were answered from governed definitions. The team spends Monday on the next service-line view.
Here is that new world as a chain of hand-offs between agents:
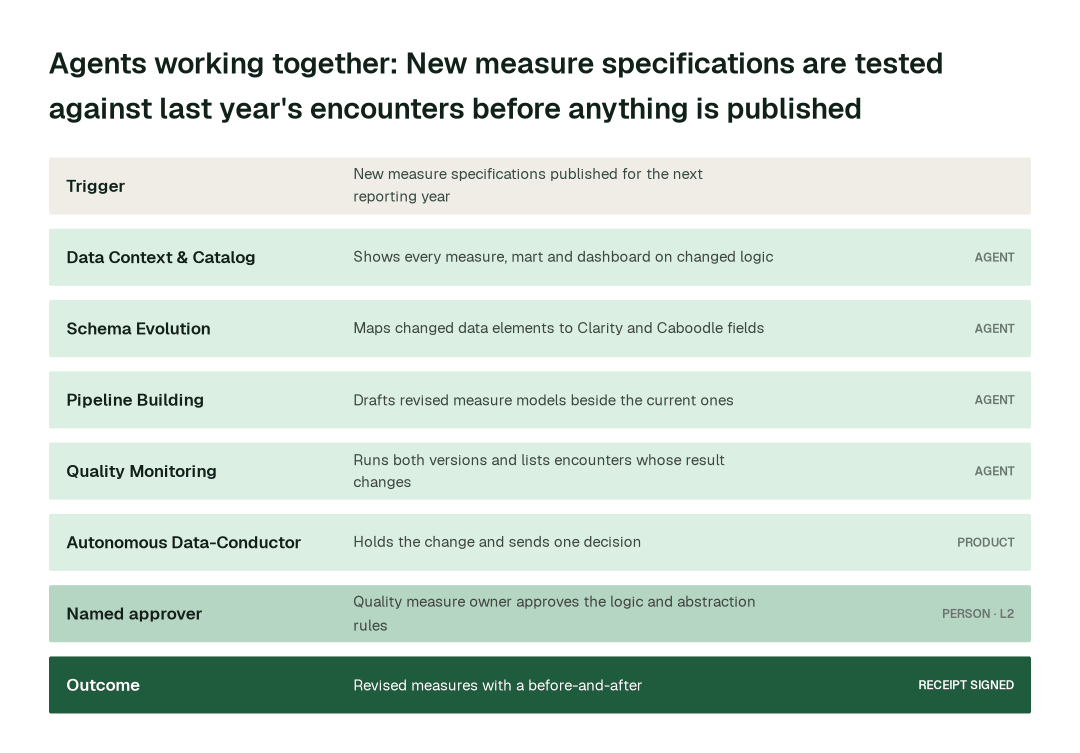
The rest of this report walks through the 6 practices that make that morning possible. At a glance:
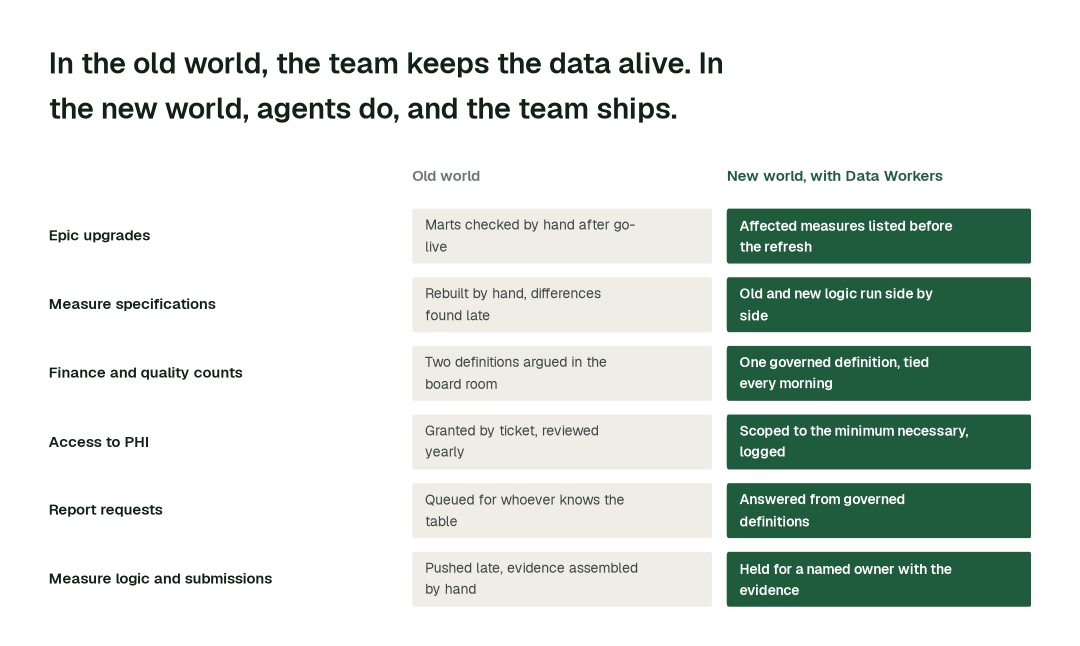
The practices, one by one
1. Trace every Epic upgrade to the measures it touches before the refresh
An EHR upgrade is a common source of silent change in a hospital warehouse. It adds, renames or retires Clarity and Caboodle tables and columns, and a measure built on them can change without a single job failing.
Why it's harder than it looks: the damage is semantic, not structural. A column that still loads but now means something slightly different passes every row-count check. The path from a column to a measure to a board scorecard runs through models and extracts built by different people in different years, so "what does this touch?" is a day of tracing under time pressure.
- 1.Schema Evolution runs
detect_schema_changeandlist_schema_changesagainst the upgraded test environment and finds renamed, retired and re-typed columns as they first arrive. - 2.Data Context & Catalog runs
blast_radius_analysisandtrace_cross_platform_lineageto list every mart, measure model, dashboard and extract that reads them. - 3.Schema Evolution runs
assess_impactandgenerate_migrationwith a rollback plan, and Pipeline Building drafts the staging mapping withgenerate_pipeline, parity tests against prior months andvalidate_pipeline. - 4.The measure owner approves anything that feeds a measure. Staging-only changes go to the data engineer on call. Nothing is applied to production without a named approver at the level you set for that domain.
See the schema change management page for the general pattern, and our post on the Schema Evolution Agent.
2. Run old and new measure logic side by side on your own encounters
Every reporting year, CMS and the measure developers update electronic clinical quality measure specifications and value sets. The eCQI Resource Center publishes them for each reporting period. What matters to you is what the update does to your own results.
Why it's harder than it looks: the specification diff tells you what changed in the logic, not which of your encounters change numerator or denominator status. Local mappings added for legacy codes can collide with new value sets, and a result that moves the opposite way from the developer's notes is easy to miss in a spreadsheet.
- 1.The quality analytics lead adds the new specifications and value sets to the project. Nothing changes in production.
- 2.Pipeline Building drafts revised measure models next to the current ones with
generate_pipeline, not over them, and checks them withvalidate_pipeline. - 3.Quality Monitoring runs
run_quality_checkon both versions across last year's encounters and reports, per measure, how many encounters change status and why. It writes tests withcreate_quality_tests_for_pipelineso unchanged measures must match last year. - 4.Incident Debugging runs
get_root_causeon results that do not make sense, such as a duplicated local mapping. - 5.The quality measure owner approves the logic measure by measure, with the side-by-side and the list of encounters that move.
Practices like these compound. Across the routine work they cover, here is the difference in elapsed time:
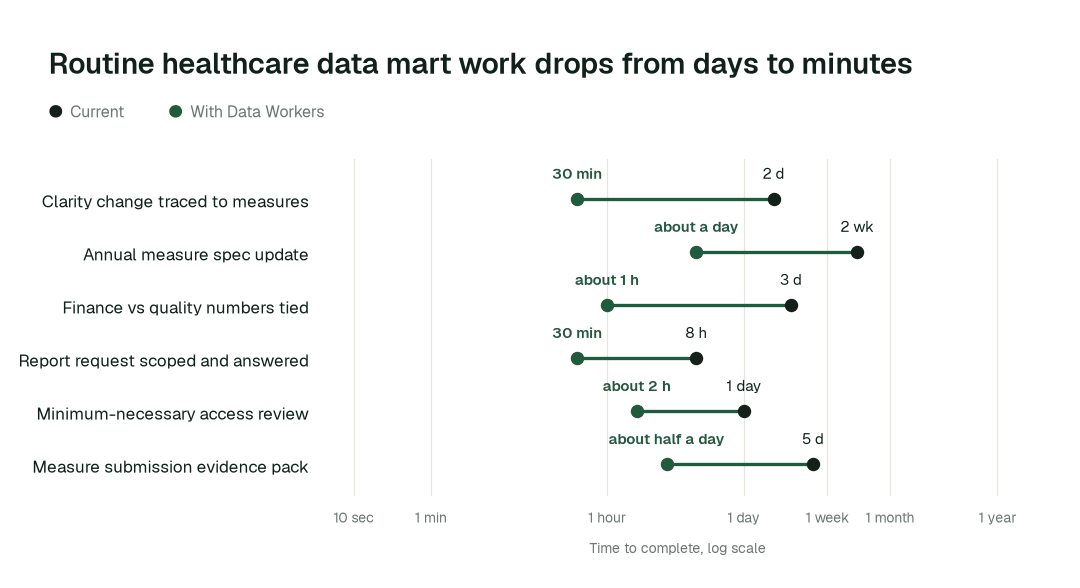
The biggest change is the annual measure spec update: from about 2 weeks to about a day. Work that waited in queues finishes in minutes or hours, because agents detect, fix and verify in one pass.
3. Tie finance and quality to one governed definition, every morning
When service-line finance and quality publish different discharge counts, every downstream view loses credibility. It matters more once an AI assistant answers the board's questions from the same warehouse.
Why it's harder than it looks: both numbers are usually defensible. Finance counts from the patient accounting feed and quality from the encounter, and the gap comes from an exclusion in one mart, a status that changes after discharge or a late-posted account. A definition also lives in a SQL view, a dashboard filter and an analyst's head, and each copy drifts. Reconciling once a quarter means the cause is gone by the time anyone looks.
- 1.Quality Monitoring runs
run_quality_checkeach morning to tie both marts to the same encounters and lists the gap. - 2.Data Context & Catalog runs
resolve_metricto show which definition each report used. - 3.Incident Debugging runs
get_root_causeto trace the gap to the rule or change behind it. - 4.Data Context & Catalog proposes one governed definition with
define_business_rule, marks the authoritative tables withmark_authoritativeand documents the legitimate differences. Data Context Wizard then serves it to dashboards, extracts and every agent. - 5.The finance lead and the quality measure owner both approve the definition. If they differ on purpose, the difference is recorded as a decision.
The same approach underlies our cost of care work.
4. Scope PHI to the minimum necessary, per request
Nearly every table holds PHI. The HIPAA Privacy Rule's minimum necessary standard expects uses and disclosures to be limited to what the purpose needs.
Why it's harder than it looks: access is granted by ticket, reviewed once a year and rarely narrowed. New tables arrive with identifiers nobody classified, and someone must be able to show who saw what, on demand.
- 1.Data Access & Governance runs
scan_piion every new table and extract so identifiers are found at the door. - 2.It checks each request against the requester's role and purpose with
check_policy. - 3.It applies the narrowest access with
enforce_rbacandprovision_access, and logs every grant. - 4.It runs
generate_audit_reportso "who saw what" has an answer in minutes. - 5.The privacy officer or data steward approves any new access to identifiable data. Agents never widen access on their own.
Further reading: data governance for healthcare, HIPAA data governance automation and zero-ticket data access.
5. Answer the report queue from governed definitions, and retire what nobody reads
Many requests are the same question with a different date range or unit.
Why it's harder than it looks: the answer depends on which definition applies, which table is authoritative and whether the requester may see the result. An analyst resolves all three each time, and the extracts they send are never retired.
- 1.Data Science & Insights answers a routine request through the governed definitions, with the source shown. See the Data Science & Insights Agent.
- 2.Data Context & Catalog runs
check_freshness, and Data Access & Governance runscheck_policy, before anything is returned. - 3.Requests that need a new definition, a new source or wider access go to an analyst with the context already gathered.
- 4.Usage Intelligence runs
get_adoption_dashboard, and Data Context & Catalog runsdetect_dead_assets, to propose retiring what nobody uses, with the downstream check first. - 5.The mart owner approves each retirement.
See also our clinical quality use case.
6. Hold measure logic and every submission for a named owner
A measure feeds public reporting, accreditation and sometimes payment. Trust depends on a person owning those numbers.
Why it's harder than it looks: either everything waits for review and the queue grows, or changes go straight to production and get reversed after a complaint. Submissions run on a fixed calendar, with evidence assembled by hand.
- 1.Agents propose with the full diff, the blast radius and how to undo it. Autonomous Data-Conductor checks that unchanged measures still match and that no dashboard reads a model about to change.
- 2.Data Access & Governance runs
request_governance_reviewto route the decision to the right owner. - 3.The quality measure owner approves measure logic and abstraction rules, with a side-by-side on your own encounters.
- 4.Agents assemble the evidence behind each submission with
generate_audit_report, and never send the file. - 5.The named submitter sends it to CMS or the other regulator.
That balance, autonomy where work is reversible and a named owner where it matters, shows up by task class:
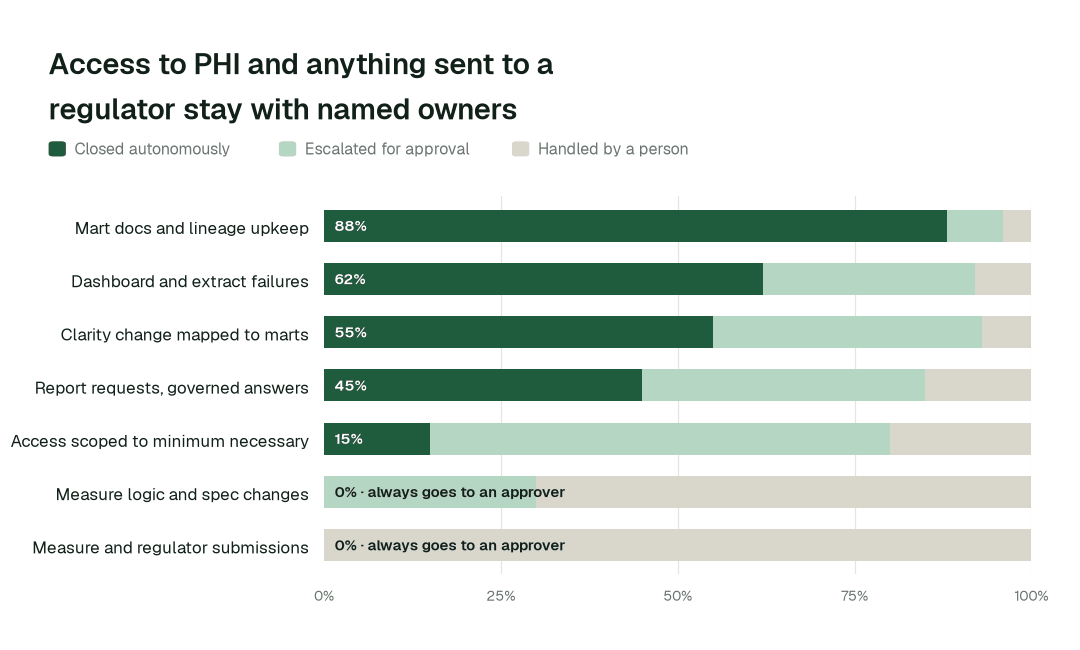
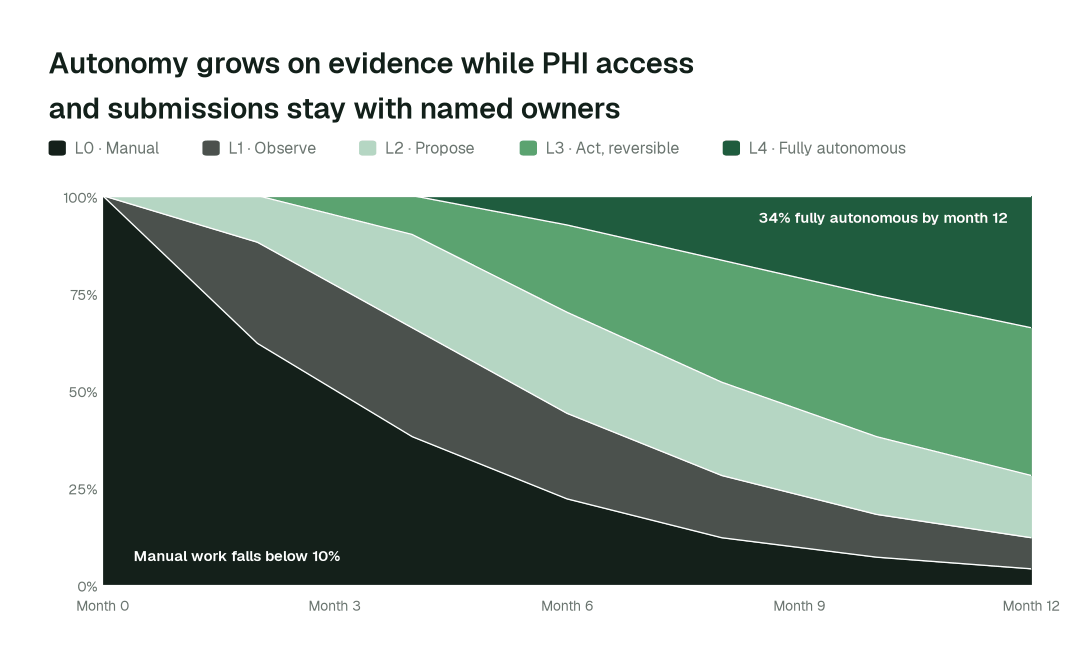
Mart docs and lineage upkeep is the class we target to close autonomously 88% of the time as a deployment matures. For measure and regulator submissions, autonomous closure is 0% by design.
Designing the autonomy ladder
Autonomy is set per task class, and only a domain's owner can raise it. L0 watches, L1 suggests, L2 acts after a named person approves. L3 and L4 act with progressively less supervision on a domain's own review record: they are where a domain can go on evidence, not where any class starts. L0 to L2 run today.
| Task class | L0 | L1 | L2 | L3 | L4 |
|---|---|---|---|---|---|
| Mart docs and lineage upkeep | Start | Pilot week 1 | Week 2 | On evidence | On evidence |
| Clarity and source change mapping | Start | Pilot week 1 | Week 2 | On evidence | Not for measure fields |
| Finance and quality tie-out | Start | Pilot week 1 | Week 2 | On evidence | On evidence |
| Report requests | Start | Pilot week 1 | Week 2 | On evidence | Not for new access |
| New access to PHI | Start | Suggest | Owner approves | No | No |
| Measure logic | Start | Suggest | Owner approves | No | No |
| Regulator submissions | Evidence only | Evidence only | Evidence only | No | No |
If people start reverting the agents' changes in a domain, it pauses itself.
The operating model: who owns what
Agents change who does the work, not who is accountable for it:
| Role | Owns | What the agents take off their plate |
|---|---|---|
| Director of Healthcare Analytics | Standards, autonomy per domain, which domain goes next | Assembling status, chasing owners |
| Quality measure owner | Measure logic and the side-by-side each reporting year | Preparing the specification diff and rollback plan |
| Privacy officer or data steward | Access to identifiable data | Finding PHI in new tables, compiling the audit report |
| Finance lead | Service-line definitions and the tie to the ledger | Tracing a finance and quality gap to its cause |
| Regulatory reporting analyst | Every file sent to a regulator | Assembling the evidence |
The swarm behind the practices
No single agent delivers these practices. Each one is a hand-off between specialists, coordinated under the autonomy you set per domain.
| Agent | What it does on a healthcare analytics team | Public tools it calls |
|---|---|---|
| Schema Evolution | Maps Epic upgrade changes and specification data elements into the marts | detect_schema_change, assess_impact, generate_migration |
| Pipeline Building | Builds and versions measure and mart models, with parity tests | generate_pipeline, validate_pipeline |
| Quality Monitoring | Ties finance to quality and measures to last year | run_quality_check, create_quality_tests_for_pipeline |
| Incident Debugging | Traces a discrepancy to the change that caused it | diagnose_incident, get_root_cause |
| Data Access & Governance | Scopes access to the minimum necessary and logs every grant | scan_pii, check_policy, provision_access, generate_audit_report |
| Data Context & Catalog | Keeps every mart, measure and dashboard documented | blast_radius_analysis, resolve_metric, define_business_rule |
| Usage Intelligence | Shows which dashboards and extracts are used | get_adoption_dashboard |
Data Context Wizard holds one governed definition of a discharge, a readmission, a case and every measure population, and every dashboard and agent reads it. Autonomous Data-Conductor verifies the numbers that matter before they are published. Spellbook Data Catalog is agentic governance and a catalog that makes each mart discoverable in plain English.
What disappears
The clearest sign the practices are working is what stops happening:
- •The Monday dashboard surprise after an Epic upgrade.
- •The board slide with two discharge counts.
- •Weeks of rebuilding measure logic by hand each reporting year.
- •Extracts sent to people who no longer need them.
- •The same readmissions question answered five times.
The back office simply keeps running. Changes are caught where they enter, not where they are read. New tables are classified for PHI and documented without anyone writing it. Access follows policy instead of a queue. Every action leaves a signed receipt in a tamper-evident audit trail, so the team can show what happened and roll anything back.
An analytics director's scorecard
If you own the numbers, these are the targets to bring to every quarterly review. They are targets to set with your baseline, not results:
- •Time from an Epic or feed change to a verified, mapped model, targeting hours rather than days.
- •Time to complete the annual measure specification update, targeting about a day against about two weeks today.
- •Days per month finance and quality tie to the same encounters, targeting every day.
- •Share of measures with one governed definition and a named owner.
- •Share of access grants scoped to the minimum necessary, with a logged approver.
- •Share of documentation and lineage upkeep closed autonomously, targeting 88% as the deployment matures.
- •Report requests answered from governed definitions without an analyst.
Where this goes next
Neighbouring teams share the warehouse: see the revenue cycle and population health reports, the clinical data field guide for extraction, and the health and life sciences group.
The climb: from assisted to autonomous to agentic
Our thesis is that the data platform climbs the way analytics did, in stages, and that the hard part of data work was never knowing what to do but doing it. For healthcare analytics teams:
- •Assisted. Agents read the whole stack, show what an upgrade or specification change touches and propose every fix with a receipt.
- •Autonomous, under your governance. Routine work runs on its own, domain by domain, as each earns it. Your team governs the agents instead of doing the upkeep.
- •The agentic enterprise. An analytics team that builds the next service-line view instead of rebuilding marts.
You choose the altitude, every step is visible and reversible, and the pilot below is the first rung.
The pilot: how healthcare analytics teams start
The pilot is how your team proves the value on its own data before committing.
- •Scope. A Clarity upgrade and the annual measure refresh for the quality marts at L2, connected over MCP to the warehouse, dbt project, scheduler and BI layer you run, inside your environment. Nothing migrates.
- •First week. Agents run at L1. They map every mart, measure definition and lineage path and show the fixes they would have made, with receipts, before anything changes.
- •By week two. Source change mapping and finance-to-quality tie-outs start on reversible work. Measure logic stays at L2 with a named approver, and PHI access and submissions stay with their owners.
- •At day 30. We review the impact metrics against your baseline:
- •Clarity change traced to measures: from about 2 days to 30 min
- •Finance and quality numbers tied: from about 3 days to about 1 h
- •Annual measure spec update: from about 2 weeks to about a day
- •What you decide. Whether to expand to the next domain. The pilot fee is credited in full against the first year.
- •Guarantee. In a 90-day pilot, we target ten engineering hours per data engineer per week recovered against a baseline both sides sign on day one, or the $7,500 fee is refunded.
- •Cost. Start with a pilot ($7,500 one-time, credited in full against the first year). Scale is from $1,000 a month and Enterprise from $3,000 a month, billed annually, with unlimited seats, no usage meter and no markup on model spend. See pricing.
The pilot is the start of a longer curve:
Data Workers doesn't make you compliant; your controls, people and assessors do. It supplies controls and evidence wherever agents touch data. Not legal advice.