What's the ROI of agentic data operations?
Where the return on AI data agents comes from: engineer hours given back, lower warehouse spend, fewer and shorter incidents, fewer point tools. A worked model with every assumption shown, and the metrics to track.
The return on agentic data operations comes from four places: engineer hours given back from tickets, incidents, backfills and migrations; lower warehouse spend once agents trace credits to the models behind them and draft the fixes; fewer and shorter data incidents; and one platform doing the work of several point tools. The cost side is a flat platform fee with unlimited seats plus your own model bill, so for most data teams the hours alone cover the cost and the warehouse savings are the upside.
This page shows the arithmetic in the open, with the same inputs, formulas, design targets and prices as our ROI calculator, so your own numbers give you the same answer we get here. Data Workers is the agentic data platform: 20+ specialist agents that work the tickets, fix the incidents and trace the spend across your estate, behind approvals, with a receipt for every change. A receipt is also a measurement, which is what makes the return provable.
Key takeaways
- •The biggest line is time. Every ticket or incident an agent closes with a receipt is an hour your engineers spend on new work.
- •Warehouse savings are a design target, measured in your pilot. The Cost Savings agent is designed to cut warehouse spend 25 to 40% by tracing credits to the dbt model behind them and getting each fix, drafted, to its owner.
- •The cost is flat. Scale from $1,000 a month and Enterprise from $3,000 a month, billed annually, with unlimited seats, no usage meter and your own model at no markup.
- •Break-even is low. In the worked example, agents need to close about 12% of ticket and incident work to cover Scale plus the model bill, with warehouse savings set to zero.
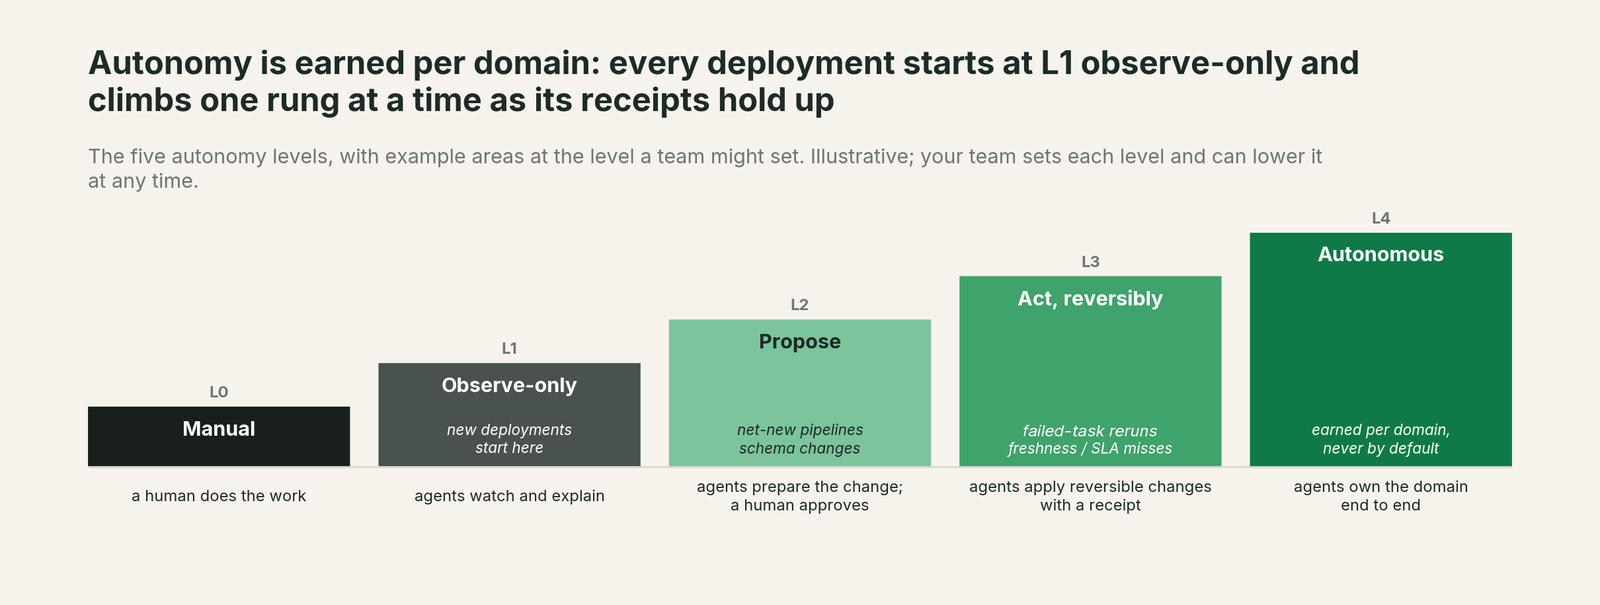
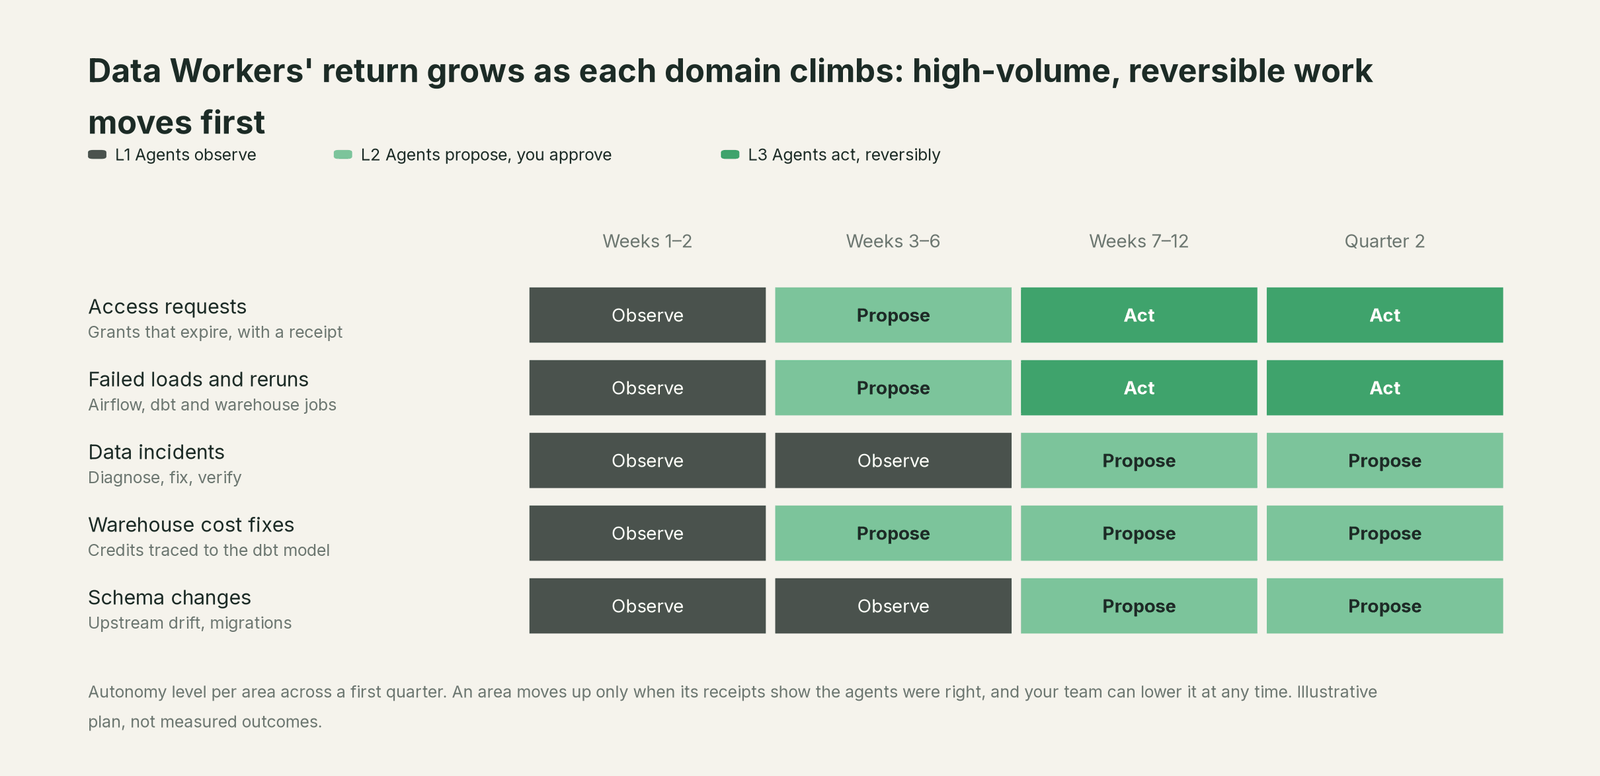
- •The return grows as domains climb. Each domain starts at L1 observe and earns L2 propose and L3 act reversibly on its own record.
Where the return comes from
Engineer hours. Access requests, broken dashboards, failed loads, schema questions and backfills arrive as small, constant tickets, which is why data engineering toil adds up faster than it looks. In dbt Labs' State of Analytics Engineering 2025 report (published April 29, 2025; 459 data practitioners and leaders), 57% of respondents said they spend most of their workdays maintaining or organizing data sets. The governance agent's provision_access and check_policy handle access through the permission systems you already run, and the Conductor reruns and verifies failed loads.
Fewer and shorter incidents. Incidents cost hours and trust (the cost of data downtime). In Monte Carlo's State of Data Quality survey, conducted by Wakefield Research with 200 data professionals in March 2023 (third-party, vendor-commissioned), respondents averaged 67 data incidents a month and 15 hours to resolve each one, and 74% said business stakeholders find issues first all or most of the time. The incidents agent's diagnose_incident and get_root_cause find the cause across systems, remediate proposes or applies the fix at the level the domain has earned, and get_incident_history catches repeats earlier.
Lower warehouse spend. The Flexera 2026 State of the Cloud Report (third-party, 753 respondents surveyed in winter 2025) puts estimated wasted cloud spend on IaaS and PaaS at 29%, the first rise after five years of decline. That figure is self-reported and covers all cloud, but it sets the scale. The Cost Savings agent attributes Snowflake credits to the query and the dbt model, project and run behind them through query tags, reads BigQuery spend from the Jobs API, and drafts each fix, from a model change to warehouse settings, for the owner to apply after a downstream dependency check. Its 25 to 40% reduction is a design target; your pilot measures the real number.
Fewer point tools. Every slice tool adds a console, a contract and a handoff. Data Workers covers the whole lifecycle with one context graph, one approval flow and one audit trail, so teams often retire a tool or two once it runs that slice. The calculator leaves this out, along with migrations, where Data Workers' design target is 4 to 8 weeks against the 6 to 12 months teams usually plan. Both are return the model doesn't count.
The cost side
The cost is the platform fee plus your model bill.
| Item | What you pay | Grows with use? |
|---|---|---|
| Pilot | $7,500 one-time, credited in full against the first year | No |
| Scale | From $1,000 a month, billed annually | No |
| Enterprise | From $3,000 a month, billed annually | No |
| Seats | Unlimited on every plan | No |
| Model spend | Your own bill with your provider; Data Workers adds no markup | Yes, and it's yours to control |
| Open-source core | Apache 2.0 | No |
With a flat fee, the return improves every time a domain climbs the autonomy ladder, because more work closes without a bigger bill. The reasoning is in why our pricing has no usage meter; plans are on pricing.
A worked example
This is an illustration, not a customer result. It uses the default inputs on the ROI calculator, so you can reproduce every number and then swap in your own.
The team. Six data and analytics engineers at a loaded cost of $180,000 a year each, on Snowflake, dbt, Airflow, Looker and Okta. They answer 25 back-office tickets a week at 1.5 engineer hours each and handle 8 data incidents a month at 6 hours each, spend $40,000 a month on Snowflake compute and expect $1,500 a month in model spend. Planning assumption: agents close 30% to 60% of the ticket and incident work.
| Line | Formula (same as the calculator) | Result |
|---|---|---|
| Ticket hours per month | 25 tickets x 52/12 weeks x 1.5 hours | 162.5 |
| Incident hours per month | 8 incidents x 6 hours | 48 |
| Back-office hours per month | tickets plus incidents | 210.5, about 22% of the team's 940 working hours |
| Hourly cost | $180,000 / 1,880 hours | $95.74 |
| Hours returned per month | 210.5 x 30% to 60% | 63 to 126 |
| Value of those hours per year | hours returned x 12 x hourly cost | $72,555 to $145,111 |
| Warehouse spend removed per year (design target) | $40,000 x 12 x 25% to 40% | $120,000 to $192,000 |
| Modelled annual value | hours value plus warehouse | $192,555 to $337,111 |
| Annual cost on Scale | $12,000 plus $1,500 x 12 model spend | $30,000 |
| Annual cost on Enterprise | $36,000 plus $18,000 model spend | $54,000 |
The warehouse line is the larger one at this spend level, and it is a target, so look at the hours line on its own: $72,555 to $145,111 a year against $30,000 on Scale. All 210.5 back-office hours are worth about $241,851 a year at this loaded cost, so agents need to close about 12% of that work to cover Scale plus the model bill, or about 22% to cover Enterprise, before any warehouse savings.
The example sits below the published baselines on purpose: 8 incidents a month at 6 hours is far lighter than the survey's 67 at 15 hours, and 22% of team time is lighter than the dbt Labs finding. If your team looks more like those surveys, your numbers will be larger.
A week inside the example. Monday, an Okta-backed access request for a finance analyst arrives; the governance agent checks policy, drafts read access to the Snowflake schema with an expiry for the owner to apply and leaves a receipt. Tuesday, an Airflow DAG run fails on a dbt model after an upstream column rename; the incidents agent traces the break across Airflow, dbt and Snowflake and proposes the model fix, a named engineer approves it, and the Conductor reruns the load and checks the Looker dashboard before marking the incident fixed and verified. Thursday, the Cost Savings agent traces a jump in Snowflake credits to one dbt model moved to a larger warehouse and drafts the change back, with its consumers checked; the model owner applies it. Each event is a line in the table above, with a receipt saying who or what made the change, why, what it touched and how to undo it.
How the share of work grows
The share of work agents close moves the whole model, so it should rise only on evidence. Every domain starts at L1 observe. At L2 propose, a named engineer approves each fix. At L3 act reversibly, agents make reversible changes on their own, such as expiring access grants and reruns. L4 autonomous is set domain by domain, and your team can lower any level at any time.
Access requests and failed loads usually climb first: volume is high, receipts pile up fast and a mistake is cheap to undo. Incidents and schema changes stay at L2 longer because the blast radius is wider. The safety page covers what each level allows and how rollback works.
What to measure
ROI you can't measure is a forecast. Baseline these numbers on day one of the pilot from your own ticket queue, incident log and warehouse bill, and report them monthly by domain and autonomy level. The usage intelligence agent's get_tool_usage_metrics and get_audit_trail give you the agent side of the record.
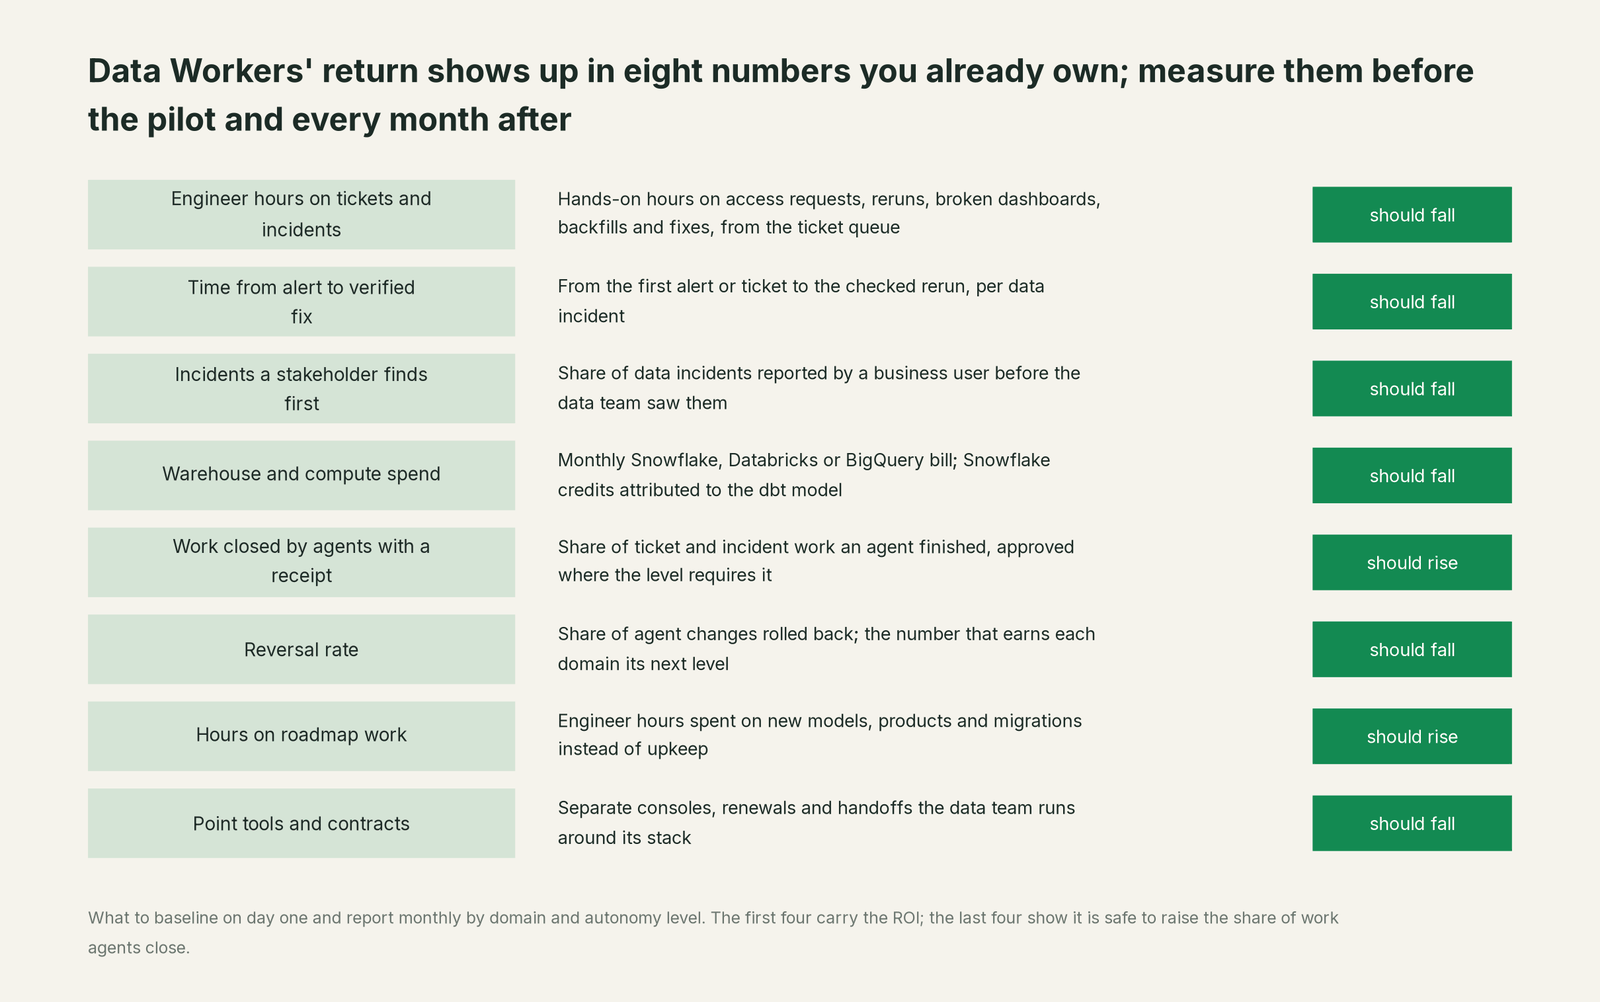
If the reversal rate stays low while hours fall, the domain has earned its next level. Our guide to measuring whether AI data agents are doing a good job goes deeper on evaluation, the observe-only review and acceptance rates.
The alternatives buyers weigh
Each alternative has a real return; the question is which covers most of the four sources for the least ongoing cost.
Hire. Another engineer adds capacity at $180,000 a year in the example and joins the same ticket queue. Hiring and Data Workers work well together: agents take the queue, the new engineer takes the roadmap (will Data Workers replace your data team?).
Build it yourself. A coding agent plus vendor MCP servers gets a convincing demo in a week; the return then depends on the layer you build around it: lineage across engines, blast-radius checks, approvals, rollback, receipts and evaluation. See can't we just build this ourselves with Claude Code and a few MCP servers?
Data observability. Observability tools are strong at detection and triage. Monte Carlo's pricing page (checked Oct 2, 2026) describes credits consumed at published consumption rates, pay per monitor, with every tier including incident triaging, root cause analysis and a fleet of agents. Detection lowers the cost of an incident; Data Workers adds the fix, the verified rerun and the receipt, reading observability alerts as one more signal (Data Workers vs data observability).
Warehouse-native cost controls. Snowflake resource monitors track warehouse credit usage and can send alerts or suspend warehouses at a limit; Snowflake's documentation says they work for warehouses only, with budgets for serverless features and AI services. Monitors cap the bill; the Cost Savings agent finds the model behind the credits and drafts the fix for its owner after checking who depends on it. Keep the monitors as a guardrail under the agent.
Catalogs. A catalog holds the inventory and definitions every agent needs. Data Workers plugs it into the Data Context Wizard as a first-class source and adds the work on top (bring your own context; Data Workers vs a data catalog). If your company has rolled out assistants, the AI assistants hub shows how they connect.
The case for your CFO
The outcome: the data team gets back its ticket and incident hours, the warehouse bill gets an owner for every model behind it, and the business sees fewer wrong numbers. In the worked example, hours returned alone are worth $72,555 to $145,111 a year against $30,000 for Scale plus the model bill, and the warehouse design target adds $120,000 to $192,000. Every number comes from inputs your finance team already has.
The risk story is about control. Agents start at L1 observe and only reach L2 propose and L3 act reversibly in domains whose receipts earn it. Every change is scoped by blast radius before it runs, approved where the level requires it, and recorded with who or what made it, why, what it touched and how to undo it. Nothing is migrated: Snowflake, dbt, Airflow, Looker and your permission systems stay as they are.
Why now: the assistants and coding agents your company already pays for speak MCP, so governed agent work across the stack is possible today, while tickets, incidents and waste grow with the estate.
The first win is the ticket queue: access requests and failed loads, high in volume and reversible, measurable inside the pilot.
The pilot path: start with a pilot at $7,500 one-time, and the pilot is credited in full against the first year. Plans and terms are on pricing, and the ROI calculator runs your own numbers.
The sentence to repeat upstairs: "We pay a flat fee, agents close our data tickets and incidents with a receipt for every change, and our own records show what it returns."
FAQ
Is the 25 to 40% warehouse saving a promise? No. It is the Cost Savings agent's design target, and what you recover depends on how much waste your estate carries. The pilot measures your actual number on your own bill.
What share of work should we assume agents close? The calculator defaults to 30% to 60%, and break-even in the worked example is about 12% on Scale. Raise the share only as domains climb from L2 propose to L3 act reversibly on their own record.
Do model costs eat the return? The model bill is your own, paid to your provider with no markup, so it is visible and yours to control. The worked example budgets $1,500 a month. Our page on which model Data Workers uses and what it costs to run covers sizing.
Are returned hours real savings or just capacity? Capacity, unless you would otherwise hire. A CFO can treat it as avoided hiring or faster delivery, which is why "hours on roadmap work" is on the metrics chart.
How do we prove the numbers on our own data? Run the pilot. A forward-deployed engineer connects your estate and runs the first domains with your team, the baseline comes from your own records, and every change leaves a receipt, so the result is measured rather than modelled. See what a pilot looks like.
Where does our data go while agents work? Agents work through the permission systems you already run, with scoped access and a receipt for every change. The security, privacy and deployment page covers deployment and data flow.
Sources
- •Data Workers ROI calculator, inputs, formulas and design targets: https://dataworkers.io/roi-calculator/ (checked Oct 2, 2026)
- •Data Workers pricing: https://dataworkers.io/pricing/ (checked Oct 2, 2026)
- •Inside the Cost Savings and Data Cleanup agent, design target and dependency tiers: https:///blog/cost-savings-cleanup-agent/ (checked Oct 2, 2026)
- •Monte Carlo, The Annual State of Data Quality Survey (Wakefield Research, 200 data professionals, March 2023; published May 2, 2023): https://montecarlo.ai/blog-data-quality-survey (checked Oct 2, 2026)
- •dbt Labs, State of Analytics Engineering 2025 (459 data practitioners and leaders; published April 29, 2025): https://www.getdbt.com/resources/reports/state-of-analytics-engineering-2025 (checked Oct 2, 2026)
- •Flexera 2026 State of the Cloud Report (753 respondents, winter 2025): https://info.flexera.com/CM-REPORT-State-of-the-Cloud (checked Oct 2, 2026)
- •Monte Carlo pricing: https://montecarlo.ai/pricing (checked Oct 2, 2026)
- •Snowflake documentation, Working with resource monitors ("Resource monitors work for warehouses only"): https://docs.snowflake.com/en/user-guide/resource-monitors (checked Oct 2, 2026)
- •Data Workers open-source core and public tool registrations: https://github.com/DataWorkersProject/dataworkers-claw-community (checked Oct 2, 2026)