How do you measure whether the agents are doing a good job?
Measure AI data agents like a team: outcome metrics (incidents caught first, time to detect and resolve, turnaround, spend), quality metrics (approvals, rollbacks, false alarms, verification) and trust metrics, all read from receipts.
You measure AI data agents the way you measure a team: by outcomes (incidents caught before users, time to detect and resolve, backfill and ticket turnaround, warehouse spend), by quality (how often owners approve proposals unchanged, how often changes are rolled back, how many alerts were false alarms, how many changes were verified after landing) and by trust (the autonomy level each domain holds over time, and the evidence that earned each step). With Data Workers, every one of those numbers is read from the receipts, approval records and hash-chained audit trail the agents leave behind, so the scorecard is a byproduct of the work, not a survey.
That makes the review simple to run. Domain owners read their numbers weekly, the data leader reads the whole scorecard monthly, and autonomy changes are decided at those reviews on the record. Here is what to track, where each number comes from, and how other tools report on agent work.
Key takeaways
- •Three families of metrics. Outcomes show the business result, quality shows whether the agents' work holds up, and trust shows how much of the work your team lets them do.
- •Every number has a source record. Incident timelines, approval tickets, rollback records, post-change checks and the hash-chained audit log are written as the agents work, in your environment.
- •Rollback rate is the core of your change fail rate. DORA's software delivery metric, applied to data changes, is the single best quality signal for agents that write to production.
- •Autonomy moves on evidence. Your team reviews the agents' records and receipts against a bar it sets; a reasonable starting bar to leave observe-only is at least 100 runs, 95% agreement, under 1% errors and under 5% human overrides.
- •Baseline in week one. Measure the same numbers before the agents act, so every later review compares like with like.
What to track, and which way it should move
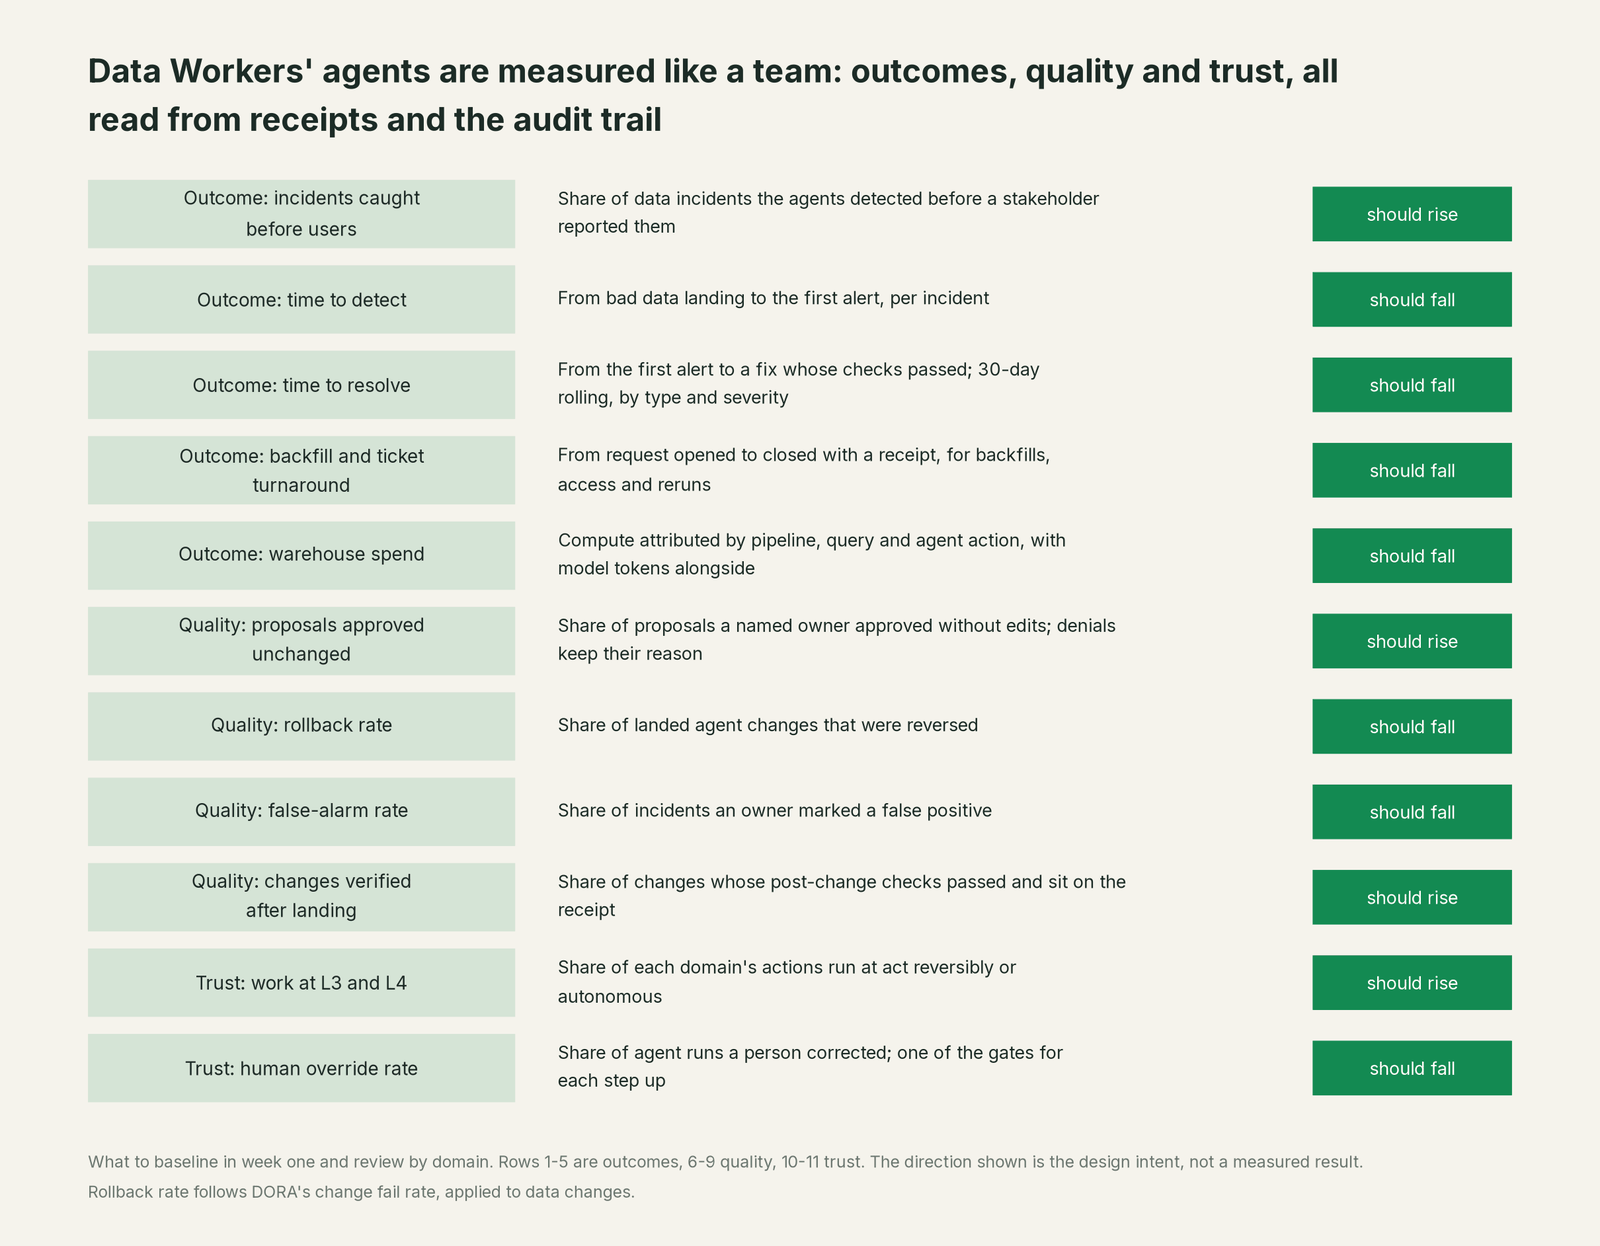
Outcome metrics are the ones your CFO already understands. Incidents caught before users is the share of data incidents the agents detected before a stakeholder reported them. Time to detect runs from bad data landing to the first alert. Time to resolve runs from that alert to a fix whose checks passed. Backfill and ticket turnaround runs from the request being opened to its close with a receipt. Snowflake spend is attributed by query and dbt model, and each agent action carries its model cost. The ROI page turns these into money, and the ROI calculator lets you put in your own team size and spend.
Quality metrics tell you whether the work is right. Proposals approved unchanged shows how often a named owner signed off without edits. Rollback rate shows how many landed changes were reversed. False-alarm rate shows how many incidents an owner marked as not real. Changes verified after landing shows how many changes passed their post-change checks.
Trust metrics tell you how far the agents have earned the right to act. Data Workers sets autonomy per domain on one ladder, and the share of each domain's work at each rung is the number to watch over time.
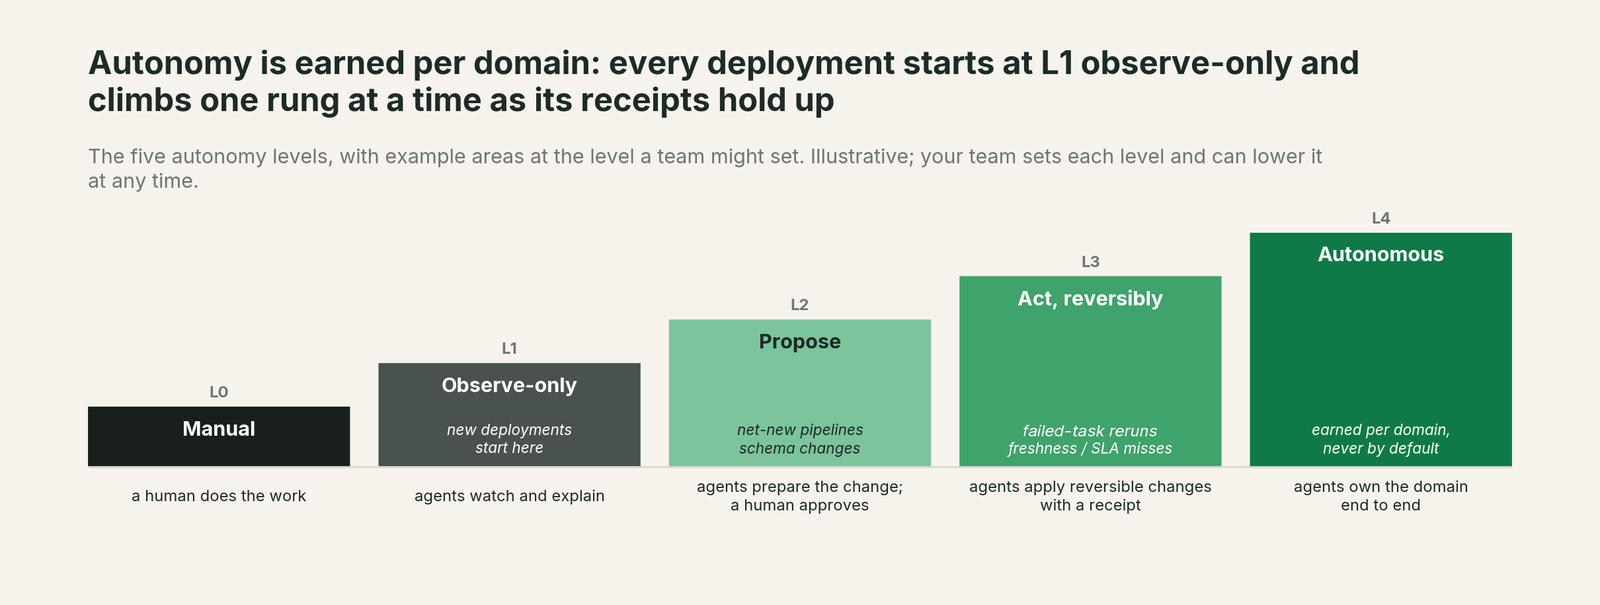
The autonomy levels explainer covers each rung: L0 manual, L1 observe, L2 propose, L3 act reversibly, L4 autonomous.
Where each number comes from in Data Workers
The scorecard is only as good as its records, so here is the record behind each row.
| Metric | Record Data Workers writes | How you read it |
|---|---|---|
| Time to detect and resolve | Each incident carries detection and resolution timestamps; a 30-day rolling report breaks time to resolve down by type and severity, with the share resolved automatically | get_incident_history with the 30-day report turned on |
| False-alarm rate | The incident log records when an owner marks an incident a false positive | Same 30-day report |
| Approval rate, approval wait and proposals approved unchanged | Every approval ticket records its requester, status (approved, denied, escalated, timed out, expired), the named approver, timestamps and the reason for any denial; compare each approval with the change its receipt shows landed to count edits | Spellbook inbox, or the audit trail |
| Rollback rate | Every reversible operation records whether and when it was rolled back | Audit trail and receipts |
| Changes verified after landing | Tools declare exit criteria, and an action counts as done only when the evidence for each one passes; a receipt's status is passing only when every required check passed | The receipt on each change |
| Warehouse spend | The cost agent attributes Snowflake credits to each query and the dbt model, project and run behind it through query tags, reads the BigQuery account total from the Jobs API, and prices each agent action's model tokens alongside | Snowflake attribution history and per-action model cost |
| Agent health | Latency, error rate, token use and confidence per agent; human evaluation scores by accuracy, completeness, safety and helpfulness | get_agent_metrics, get_evaluation_report, check_agent_health |
| Autonomy and what earned it | The ladder's log of what each action would have needed at L1; your team's review of the agents' records against the bar it set; every autonomy change records who made it | Ladder log, receipts and audit trail |
Three rows join Data Workers' records to your own, and your BI does the join. Time to detect needs the time bad data landed, from your warehouse load history or orchestrator. Incidents caught before users needs the stakeholder reports in your ticket queue or support channel. Backfill and ticket turnaround starts at the open time in your ticket system and ends at the receipt. Data Workers supplies its side of each one over MCP.
Underneath all of it is the audit trail. Every tool call is written to a SHA-256 hash-chained log, each entry linked to the one before, so an edit anywhere breaks the chain. Your auditors and your reviewers read it through get_audit_trail, and verify_global_hash_chain checks its integrity across every agent. The safety page covers what each entry holds.
People who don't live in a terminal read the same records in Spellbook Data Catalog (in preview): where the work is going, what's running now and what needs a decision, one inbox to approve, steer, send back or roll back with the full trace of what the agent saw and why it acted, and asset pages that keep what broke and how it was fixed. The agents run in your infrastructure and write receipts and the audit log there; your data stays in your systems, and the hosted Conductor sees workflow metadata only. The security and deployment page covers what stays where.
Borrow DORA's definitions, apply them to data changes
Software teams already agree on how to measure change. DORA, the research program behind the State of DevOps reports, defines change fail rate as "the ratio of deployments that require immediate intervention following a deployment," likely resulting in a rollback or a hotfix, and failed deployment recovery time as the time to recover from such a deployment (third-party definitions, dora.dev, updated January 5, 2026).
Those map cleanly onto agents that change data. An agent's change fail rate is its rollback rate plus any change that needed a follow-up fix. Its recovery time is how long a bad change stayed live before the recorded rollback path undid it. Using a definition your engineering org already reports on means the data team's numbers sit next to the platform team's numbers in the same leadership review, with no new vocabulary to defend.
A review cadence that moves autonomy on the record
| Review | Who | What they read | What they decide |
|---|---|---|---|
| Weekly | Each domain owner | Their domain's denials and edits, rollbacks, false alarms, open approvals | Tune checks and scopes; mark false alarms; flag anything for the monthly review |
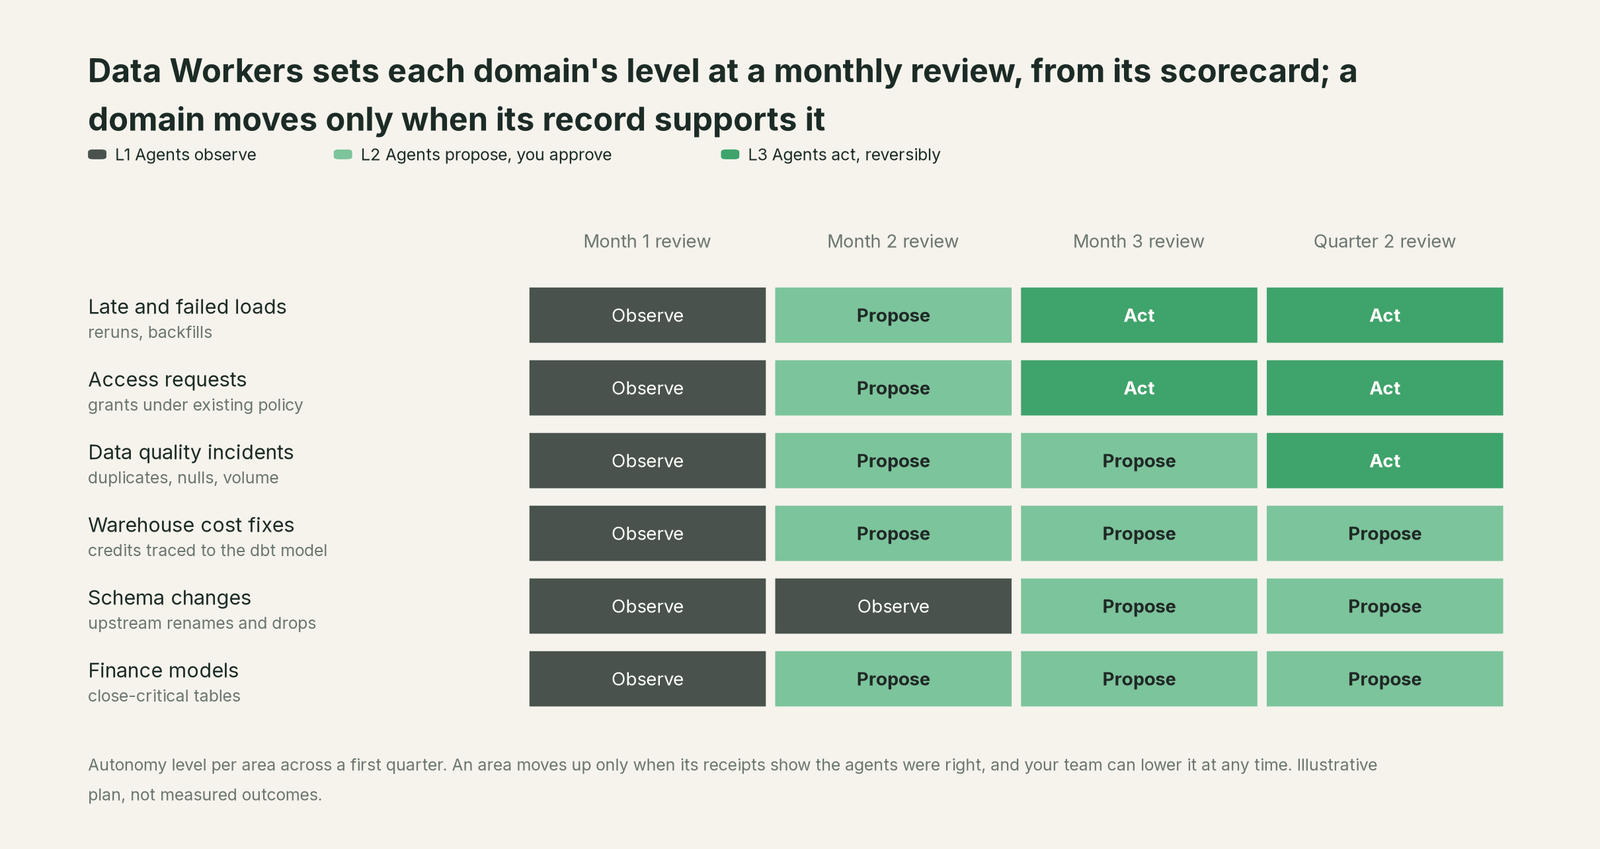
| Monthly | Data leader with domain owners | The full scorecard by domain against the week-one baseline | Raise, hold or lower each domain's level |
| Quarterly | Data leader with platform, security and finance | Outcome trends, spend, audit-trail integrity check | Which new domains join; what goes upstairs |
A domain moves up when its record clears the bar. Your team sets that bar per domain and reviews the record against it; a reasonable starting point is at least 100 runs, 95% agreement with what your team did, under 1% errors and under 5% human overrides. A domain moves down just as easily: one bad month on rollbacks and the owner drops it back to L2 propose. Who sets the level, who approves at L2 and who can pause everything is covered on who owns the agents.
An illustration: one domain's monthly review
This is an illustration, not a customer case, and the counts are illustrative. A team runs Fivetran into Snowflake, dbt models orchestrated by Airflow, and Tableau for finance and sales reporting. The late-and-failed-loads domain has been at L2 propose for a month, and the data leader is reviewing it with the domain owner, an analytics engineer.
The incident report shows the agents caught every late load in the month before the 08:00 Tableau extract refresh, so no stakeholder reported one first. The approval records show 38 proposals: 34 approved unchanged, 3 approved after the owner changed the backfill window, and 1 denied, with the reason "Fivetran resync already scheduled." The rollback records show none of the approved reruns were reversed. Every change carries a passing receipt: row counts in Snowflake matched the source, and the dbt tests on the rebuilt models passed before the Tableau extract refresh. The owner's review of the observe-only weeks found the agents' suggested fix matched what on call did on 104 runs out of 108, and the team set those numbers next to the bar it wrote.
The decision: the domain moves to L3 act reversibly for reruns of failed Airflow tasks and the dbt models behind them, while backfills wider than seven days stay at propose. The autonomy change is recorded with the leader's name. Next month's review reads the same scorecard, now including the L3 runs the owner reviewed after the fact.
How other tools report on agent work
Each of these reports well on its own layer, and teams keep them. Checked October 2, 2026.
- •Observability. Monte Carlo's Data Reliability Dashboard is "a manager overview" with incident response metrics such as Time to Response and Time to Fixed (medians), broken out by domain (docs updated July 8, 2026). Its Agent Observability turns every agent run into a trace with prompts, context, token usage, latency and errors, and evaluates output quality with LLM-as-judge or deterministic checks (docs updated August 28, 2026). Those alerts and scores feed the Data Workers loop, which carries the incident through fix and verification.
- •Platform-native agents. Snowflake's AI Observability answers what happened in a request, how a feature performs on test data, what it cost and whether Guardrails blocked it. Databricks' MLflow evaluation scores traces with LLM judges to check whether a response is "correct, grounded, safe, and complete" (last updated September 16, 2026). Both measure the agent's answer on their platform; Data Workers measures changes to production data across platforms.
- •Coding agents. GitHub Copilot usage metrics cover adoption, engagement, code generation and pull request lifecycle, with a 28-day dashboard and an export. Claude Code analytics report lines of code accepted, suggestion accept rate, active users and pull requests per user. Those are the right numbers for developer productivity, and when your engineers call Data Workers over MCP from those tools, the data changes they make land on the same receipts and scorecard.
- •Build it yourself. A coding agent plus vendor MCP servers can do the work; the measurement layer (incident timelines, approval records, rollback records, verification evidence and a tamper-evident log) is the part you would build next. The build-vs-buy page estimates that work, and our evaluation frameworks resource compares approaches.
The case for your CFO
The outcome is a data team whose agents are held to the same standard as its people: incidents caught before the business sees them, fixed faster, with less engineer time and a warehouse bill that falls where agents clean up the cause. The cost of data downtime is the number those outcomes reduce.
The risk story is measured, not promised. Rollback rate, false-alarm rate and human override rate are reviewed every month, and they gate every step up the ladder. At L2 every change waits for a named owner; at L3 changes are reversible with a recorded rollback path and a receipt; any domain can drop back a level at any review, and a kill switch stops every agent at once. Your warehouses, dbt, orchestrator, BI and catalog stay exactly as they are.
Why now: agents already touch production through the coding tools your engineers use, and a scorecard read from receipts is how you know whether that work is helping.
The first win is a baseline both sides agree on in week one, then one domain whose scorecard earns L3 inside the first quarter. The first 90 days page lays out that plan.
The path is a pilot: $7,500 one-time, credited in full against the first year. After it, Scale starts from $1,000/month and Enterprise from $3,000/month, billed annually, with unlimited seats, no usage meter and no markup on model spend. See pricing.
The sentence to repeat upstairs: "We measure the agents like a team, on outcomes, quality and trust, and they only get more autonomy when the receipts show they earned it."
FAQ
Which three metrics should we start with? Time to resolve, rollback rate and incidents caught before users. They cover outcome, quality and the business's experience, and all three come straight from records Data Workers writes.
How do we set a baseline before the agents act? In the first two weeks agents run at L1 observe: they diagnose and suggest fixes, the ladder logs what each action would have needed, and nothing writes. Pull the same metrics from your ticket queue and incident history for the prior quarter, and agree the definitions with the domain owners before any proposal is approved.
What is a good rollback rate? Set the bar per domain with its owner. Under 1% errors and under 5% overrides is a sensible starting point, and DORA's change fail rate gives your engineering org a familiar comparison.
Can we export the numbers to our own BI? Yes. The records live in your infrastructure, and the incident report, agent metrics and audit trail are available over MCP, so you can land them in Snowflake, Databricks or BigQuery and chart them in the BI tool you already run.
Do we measure the agents' model cost too? Yes. Cost attribution puts the agents' own model tokens alongside warehouse compute. You bring your own model and Data Workers adds no markup, so the number you see is what your provider bills.
Who reviews the scorecard? Domain owners weekly, the data leader monthly and a cross-functional group quarterly. The who owns the agents page covers the roles.
What if a domain's numbers get worse? The owner lowers its level at the next review or immediately, the recorded rollback paths undo any bad changes, and the domain climbs again on a fresh record.
Sources
- •Data Workers, Autonomous Data-Conductor: per-domain autonomy from observe-only to fully autonomous, a receipt on every change. Checked October 2, 2026.
- •Data Workers, Spellbook Data Catalog (preview): one inbox to approve, steer, send back or roll back, with the full trace. Checked October 2, 2026.
- •Data Workers, Pricing: pilot $7,500 one-time, credited in full against the first year; Scale and Enterprise tiers. Checked October 2, 2026.
- •Data Workers, open-source core on GitHub: registrations for
get_incident_history,get_agent_metrics,get_evaluation_report,check_agent_health,get_audit_trailandverify_global_hash_chain. Checked October 2, 2026. - •DORA, DORA's software delivery metrics: change fail rate and failed deployment recovery time. Updated January 5, 2026; checked October 2, 2026.
- •Monte Carlo, Data Reliability Dashboard. Updated July 8, 2026; checked October 2, 2026.
- •Monte Carlo, Agent Observability Overview. Updated August 28, 2026; checked October 2, 2026.
- •Snowflake, AI Observability with Snowflake Cortex. Checked October 2, 2026.
- •Databricks, Evaluate and improve. Last updated September 16, 2026; checked October 2, 2026.
- •GitHub, Copilot usage metrics. Checked October 2, 2026.
- •Anthropic, Claude Code analytics. Checked October 2, 2026.