Your Company Runs on Datadog. Now Let Data Workers Fix the Data Behind Every Alert: A Guide for Data Leaders
A guide for heads of data whose company standardizes on Datadog: what Data Observability and Bits cover, and how Data Workers diagnoses, fixes and verifies data incidents behind approvals.
Datadog is where incidents are seen and coordinated. Data Workers is where data incidents get diagnosed, fixed and verified. This guide is for the head of data or CDO whose company standardized on Datadog and wants the data back office to run itself.
Your engineering org already lives in Datadog. Services have monitors, rotations run through On-Call, and incidents are declared in Incident Management. Since Datadog acquired Metaplane (announced April 23, 2025), your data team has its own corner too: Data Observability watches freshness, row counts and column metrics on your Snowflake, Databricks, BigQuery and Redshift tables, and Data Observability: Jobs Monitoring alerts when an Airflow, dbt or Databricks run fails or slows down. When a monitor set to Auto-Investigate alerts at 2 a.m., Bits Investigation starts working out the cause before anyone opens a laptop.
Then the alert reaches your team. Someone finds the bad rows, works out which tables and dashboards they reached, writes the repair, gets it approved, reruns the job, checks the numbers and writes up what happened. The same people run the access queue, the warehouse bill and last week's audit request.
Your data platform has a control-plane problem, and the control plane is your team. People carry context by hand between excellent tools that don't talk to each other. Datadog made seeing the problem cheap. The expensive part is the doing: the fixing, the checking, the approving and the record of what happened.
What Datadog solved, and what it didn't
Datadog solved seeing. One platform watches every service, job and table, pages the right person and keeps the incident timeline. Its AI goes further than most. Bits Investigation, launched as Bits AI SRE and generally available since December 2, 2025, investigates alerts on its own and proposes a root cause from your telemetry. Bits Remediation, which includes Preview capabilities, turns code-related causes into a suggested fix from Bits Code that your engineers open as a pull request to review and merge. Its infrastructure actions, such as restarting a pod, are in Preview behind Bits Guardrails, where admins choose who must approve. The Datadog MCP Server brings all of this into Claude Code, Cursor, Codex and other clients, and checks the user's own permissions on every write.
What Datadog doesn't do is change your data. Data Observability connects to your warehouse to monitor it, with lineage to show what a failure reaches, and in the MCP Server's data-observability toolset the only writes set tags and descriptions on data entities. Nothing in Datadog owns the repair of a production table, the backfill, the check that the number is right again, or the receipt an auditor will ask for. That is the right focus for a platform that watches everything.
Datadog is where incidents are seen and coordinated. Data Workers is the agentic data platform that diagnoses, fixes and verifies the data behind them, and runs the rest of your data back office.
Or, in one sentence for your team: Datadog tells us the data broke; Data Workers traces it to where it started, takes the fix through an approval and proves it worked.
What goes on autopilot
Each of these is a queue your team runs by hand today, behind the alerts Datadog already raises.
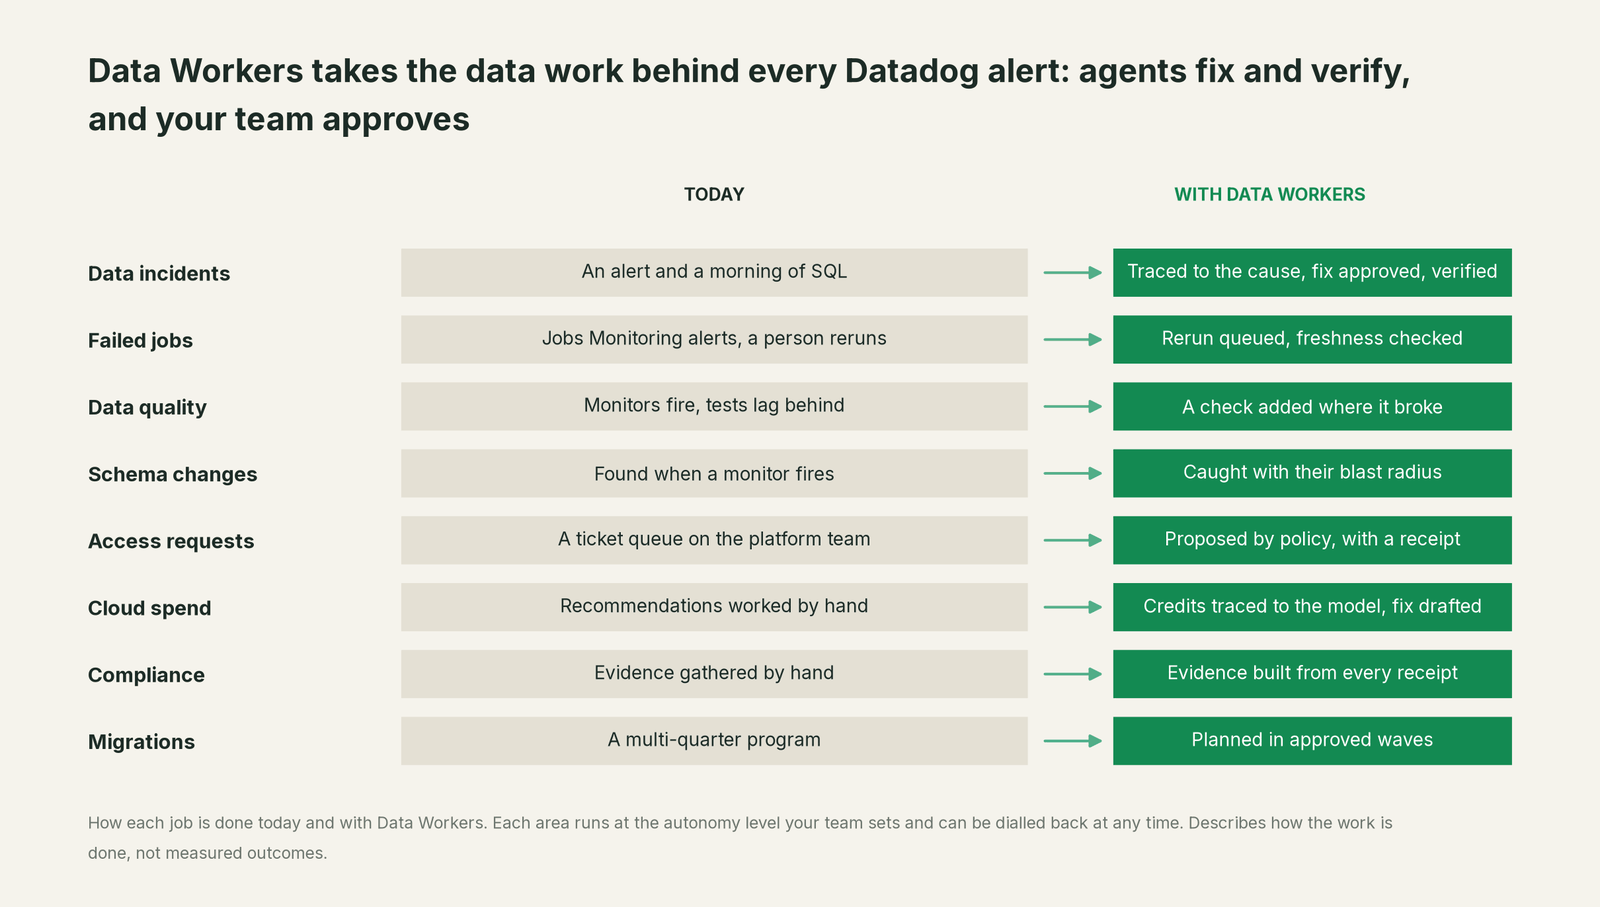
None of this requires replacing anything. Data Workers reads Datadog's monitors, metrics and traces, works inside the warehouse, dbt and orchestrator you already run, and leaves an auditable record of every change. It writes nothing back into Datadog.
What changes for your organization
Here's what that looks like in a normal week. Spend and migrations follow the same pattern: the change is drafted for its owner, approved and recorded.
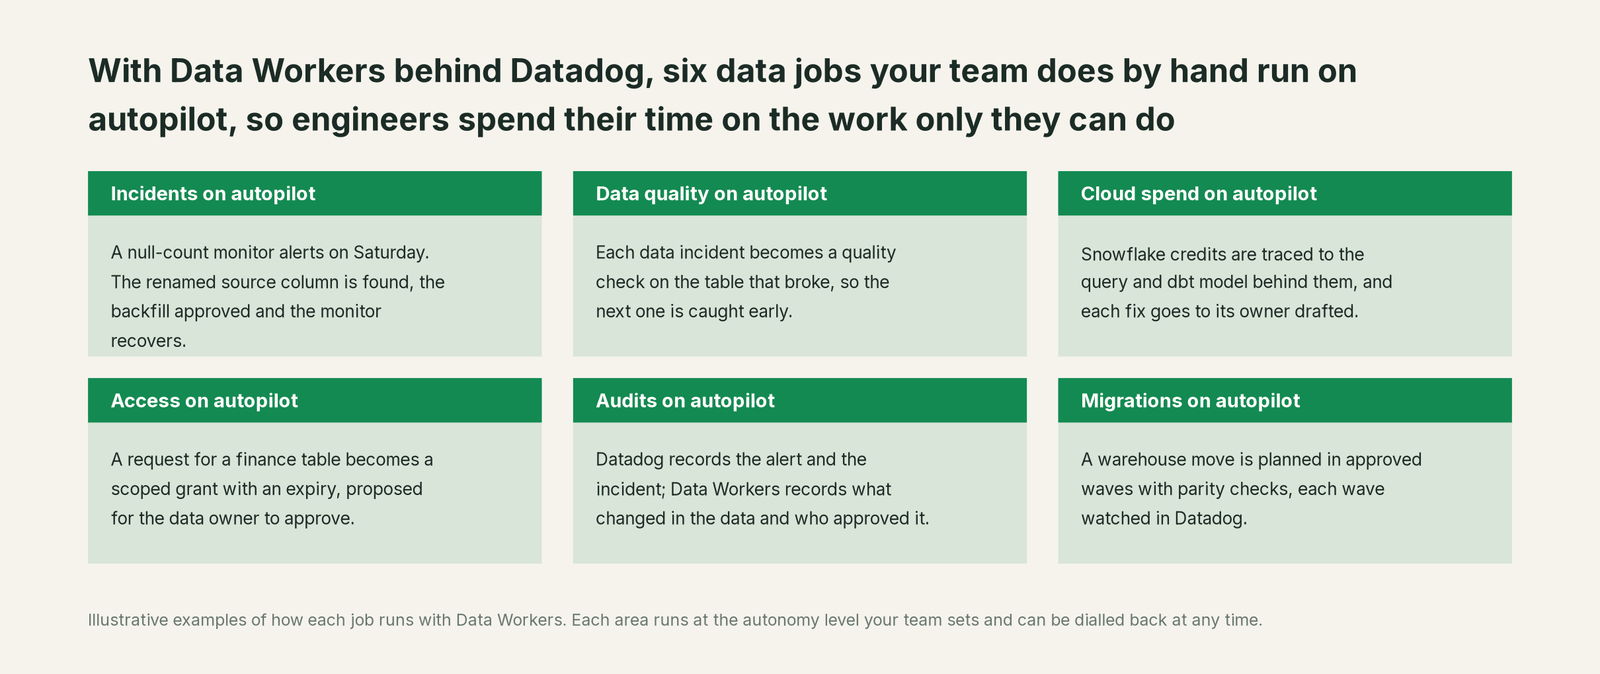
- •Data alerts stop eating the morning. A data alert arrives in the incident thread with the cause traced to the rows, everything downstream it touched and a proposed fix. Engineers review instead of doing the legwork.
- •The same break stops coming back. Each data incident becomes a quality check on the table that broke, so the next one is caught before a monitor fires.
- •On-call for data gets lighter. SREs keep their rotation, and the data step that used to wait for a data engineer arrives diagnosed, with the fix proposed.
- •Audits get easier. Datadog's Audit Trail records who did what in Datadog. Data Workers records what changed in the data, who approved it and how to undo it.
One incident, start to finish
This is an illustration, not a customer case.
- •On Friday evening, a product team renames a column in the orders service's Postgres database. The nightly Airflow load into Databricks keeps running and fills
discount_codewith nulls. - •On Saturday, Data Observability's null-count monitor on the Databricks orders table alerts, and the on-call declares an incident in Datadog.
- •The load runs twice more over the weekend.
- •On Monday at 9 a.m., marketing's Tableau dashboard shows promotion revenue near zero. Datadog showed where it broke. Someone still has to repair the data.
With Data Workers, the renamed source column is found by the time the on-call opens the alert, and everything downstream of it is mapped, down to the Tableau dashboard. Data Workers proposes the column-mapping change as a diff for the DAG owner to merge, then the backfill of the three affected partitions with its undo written down before it runs. The owner approves, Data Workers queues the backfill through Airflow and re-checks the null counts, and the Datadog monitor recovers. The on-call resolves the incident with the receipt linked, and marketing opens a correct dashboard on Monday.
You choose how far and how fast
You don't have to jump to full autonomy. You choose the altitude, one domain at a time.
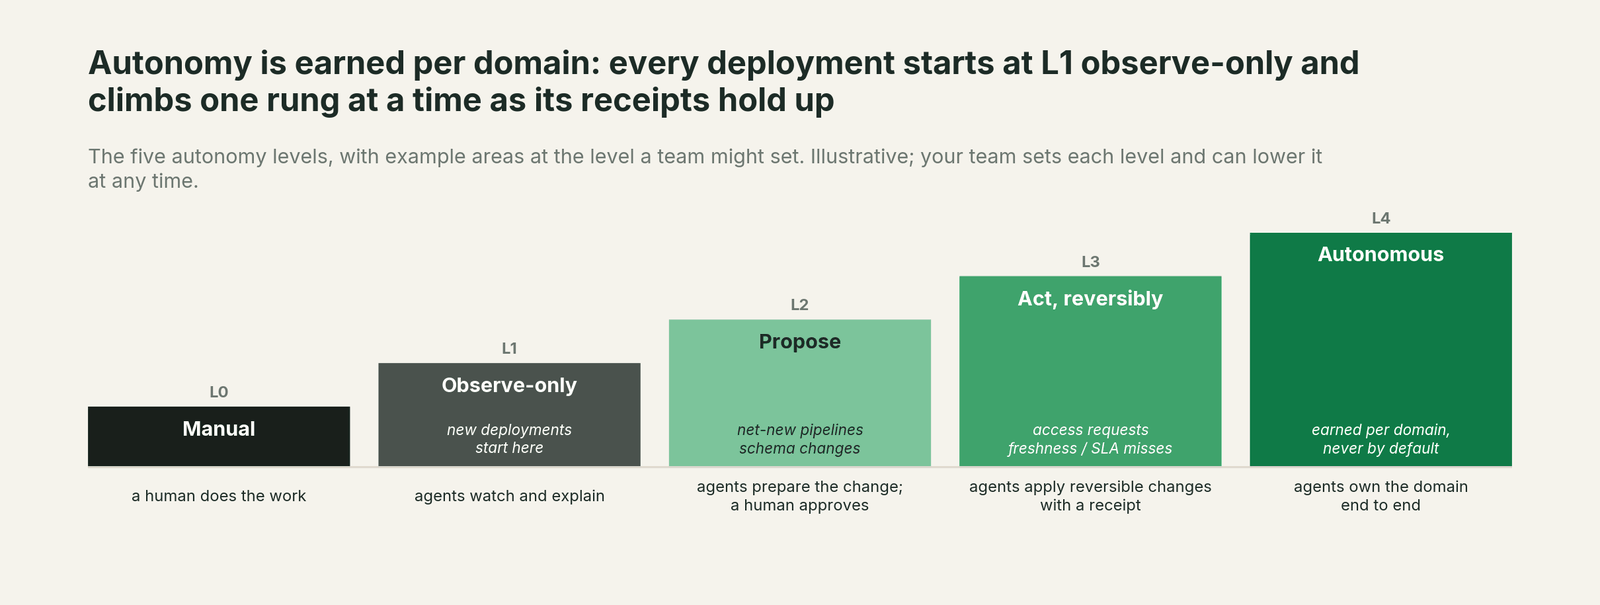
L0 manual is the work your team does by hand today. Every domain starts at L1 observe: each data alert gets a diagnosis in the incident thread and nothing changes. At L2 propose, agents propose the fix and a named owner approves it. At L3 act reversibly, change classes with a proven record, such as rerunning a failed load or backfilling a partition, run on their own with the undo written down first and a receipt left behind. At L4 autonomous, a domain that has earned it runs end to end on its own, and any domain can be dialled back at any time. No agent can promote its own work.
The ladder in detail is in autonomy levels L0 to L4 explained, and how approvals work covers who signs off on what.
Why doesn't Datadog just do this itself?
Focus and risk. Datadog watches every service you run, and its remediation path is built for that estate: code fixes as pull requests your engineers merge, and infrastructure actions behind guardrails. A data fix is a different job with a different liability. The owner of a production table approves the repair, lineage shows every model and dashboard that reads it, the backfill runs with a saved undo, and someone checks the numbers and writes a receipt an auditor can read. Owning that across warehouses, dbt and orchestrators Datadog doesn't run is a different product, a sensible line for Datadog not to cross, and the product we built.
How it fits with Datadog
- •Datadog keeps its job. Monitors, Data Observability, Bits, On-Call and Incident Management stay where they are. Data Workers connects natively and reads monitors, metrics and traces; it writes nothing back.
- •Your platforms' permissions stay the lock. Data Workers works through the roles you grant in Databricks, Snowflake, dbt and Airflow, and holds no more access than you give it.
- •Your SREs can watch the agents. Point Data Workers at your OpenTelemetry endpoint and it emits a span for every agent tool call, which Datadog ingests like any other trace.
- •Your engineers keep their client. Data Workers runs beside the Datadog MCP Server in Claude Code, Cursor or Codex: Datadog answers what fired, and Data Workers works out what broke in the data and how to repair it.
- •Your data stays in your systems. The agents run in your infrastructure and hold the warehouse credentials. Nothing is migrated, and the hosted orchestration service sees workflow metadata only. Our security and deployment guide has the detail.
When you don't need Data Workers
- •Your data incidents are rare and your team fixes them quickly by hand.
- •Datadog's monitors cover your services, and the data team has no warehouse, dbt or orchestrator in the critical path.
- •Your data team isn't the bottleneck between an alert and a fix.
If all three are true, keep your budget. If any of them isn't, the rest of this guide is about you.
The case for your CFO
The outcome. The company already pays Datadog to see incidents early, data incidents included. Data Workers turns those alerts from a morning of tracing and hand-written SQL into a diagnosis on arrival and a fix behind one approval, so the numbers the business reads are right before anyone opens them. Engineers' hours go to new work instead of cleanup.
The risk story. Autonomy is set per domain on the ladder above, and nothing changes at L2 until a named person approves. An unanswered approval request expires and escalates, never auto-grants. Every change carries a receipt: the cause, the diff, who approved it, what it touched downstream, how it was verified and how to undo it. An org-wide stop halts all autonomous dispatch. Our safety guide goes deeper, and who owns the agents covers accountability.
Why now. Bits Investigation starts on the root cause as soon as a supported monitor alerts, so the slow, expensive step is now the data fix, several systems away from the alert. And the Datadog MCP Server puts Datadog in every coding agent your engineers use, so agents already touch your data one session at a time. The choice is one approval flow and one record, or each engineer's own wiring: the trade-off in build it ourselves with Claude Code and MCP servers.
The first win. Read-only: every data alert in one domain, such as finance, gets a diagnosis and a blast radius in the incident thread.
What stays the same. Datadog, your monitors, on-call rotations, incident process, warehouse permissions and dbt review. The path is a pilot, run on your own data before you commit. The ROI guide shows how to size it.
The sentence to repeat upstairs: Datadog tells us the data broke; Data Workers takes each fix through our approval, verifies it and keeps a receipt.
Where to start
Pick one domain whose alerts already live in Datadog and end the same way every time: the tables behind the revenue dashboard, failed loads that need a rerun and a check, or the Snowflake bill.
Start with a pilot. A forward-deployed engineer connects Data Workers to Datadog, your warehouse, dbt and your orchestrator, and runs the first domain alongside your team. See pricing for how the pilot works.
For the detail, send your architects you're on Datadog, the practitioner version of this guide, and Data Workers vs data observability; incident-tool siblings are you're on PagerDuty and you're on incident.io. They cover the four products: the Autonomous Data-Conductor reads Datadog's monitors and runs each fix from detection to a verified result, the Data-Agents Swarm does the work, Data Context Wizard keeps one governed graph of definitions, lineage and owners across every platform, and Spellbook Data Catalog (in preview) is where your team approves, audits and rolls back. The thinking behind them is in our thesis.
Sources
- •Datadog press release, Datadog Brings Observability to Data Teams by Acquiring Metaplane (April 23, 2025), checked Oct 2, 2026: https://www.datadoghq.com/about/latest-news/press-releases/datadog-metaplane-aquistion/
- •Datadog Docs, Data Observability overview, checked Oct 2, 2026: https://docs.datadoghq.com/data_observability/
- •Datadog Docs, Quality Monitoring, checked Oct 2, 2026: https://docs.datadoghq.com/data_observability/quality_monitoring/
- •Datadog Docs, Data Observability: Jobs Monitoring, checked Oct 2, 2026: https://docs.datadoghq.com/data_observability/jobs_monitoring/
- •Datadog Docs, Bits AI, checked Oct 2, 2026: https://docs.datadoghq.com/bits_ai/
- •Datadog Docs, Bits Investigation, checked Oct 2, 2026: https://docs.datadoghq.com/bits_ai/bits_investigation/
- •Datadog Docs, Bits Investigation: Investigate issues (Auto-Investigate, supported monitor types), checked Oct 2, 2026: https://docs.datadoghq.com/bits_ai/bits_investigation/investigate_issues/
- •Datadog blog, Introducing Bits Investigation, your AI on-call teammate (Jun 10, 2025; GA Dec 2, 2025), checked Oct 2, 2026: https://www.datadoghq.com/blog/bits-ai-sre/
- •Datadog Docs, Bits Remediation (Preview capabilities, Bits Guardrails), checked Oct 2, 2026: https://docs.datadoghq.com/bits_ai/bits_remediation/
- •Datadog Docs, Datadog MCP Server, checked Oct 2, 2026: https://docs.datadoghq.com/mcp_server/
- •Datadog Docs, Datadog MCP Server Tools (data-observability toolset), checked Oct 2, 2026: https://docs.datadoghq.com/mcp_server/tools/