Best practices for agentic regulatory disclosure data: a field guide for sustainability reporting teams
The sustainability statement is only as good as the data under it, and an assurance provider will test that data datapoint by datapoint. This field guide shows how to prepare sustainability reporting data for CSRD and ISSB work in seven practices: one inventory of facts mapped to source, system changes traced the day they happen, daily tie-outs, versioned boundaries, evidence compiled as you go, scoped access and a named owner for every figure. Each practice shows the old world, the new world and the metric to watch.
Ask the person who owns the datapoint list behind a sustainability statement how the last assurance cycle went and the answer is rarely about the standards. It is the HR upgrade that renamed two headcount fields over a weekend, the utility portal that switched a site from kilowatt-hours to megawatt-hours, and the forty datapoints the assurance provider selected, each needing its support rebuilt from extracts, emails and screenshots. The standards are written down. The data underneath them changes every week.
The mandate is to make that data dependable under more than one set of rules: the EU's CSRD and the ESRS, ISSB-aligned reporting under IFRS S1 and S2, and the California emissions and climate-risk laws. Scope and timing keep moving, so confirm the current position for each regime with your advisers, starting from the European Commission's CSRD page and the IFRS Foundation's page for IFRS S2. The 2024 SEC climate rule is not a planning basis today. The data job does not change: every datapoint mapped to a source, tied to the ledger or operating system it comes from, and supported when someone asks.
Our view, as people who have run data platforms: most of that job is repeatable, and agents should own the repeatable part. Judgements and sign-off stay with your people. This guide is the deep companion to the regulatory disclosure data playbook; the wider set of teams is on the ESG and sustainability data teams page.
The old world
It is the second week of February and the assurance provider has selected forty datapoints. The inventory is a spreadsheet maintained by one person, who is on leave. Headcount was tied to payroll once, in December, under the old field names. The site that changed units has a thousand-fold energy figure in a draft that nobody has caught, because the total still looks plausible. An acquisition closed in the third quarter, someone overwrote the entity list, and the prior-year comparison no longer matches what was published. The team spends two weeks building support.
The new world
Same February with Data Workers. The Schema Evolution agent saw the renamed fields and the unit change the day they shipped. The Data Context & Catalog agent listed the nine datapoints that depended on them, and the Quality Monitoring agent re-tied each to payroll and energy invoices. The site that did not tie was traced to the unit switch before the draft went anywhere. The acquisition became a new boundary version beside the old one, and the published prior-year figures still reproduce. The sustainability data lead approved the remapping from her phone. When the sample arrived, the evidence already existed.
Here is that new world as a chain of hand-offs between agents:
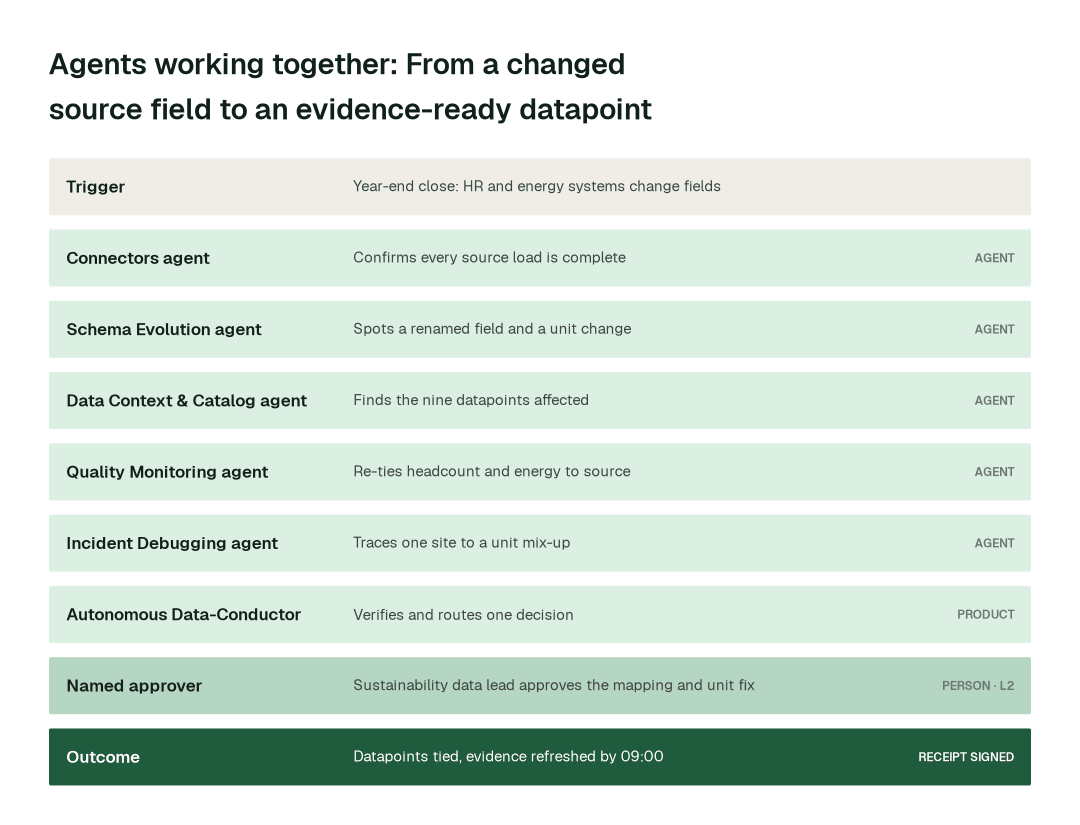
Seven practices make that morning possible. At a glance:
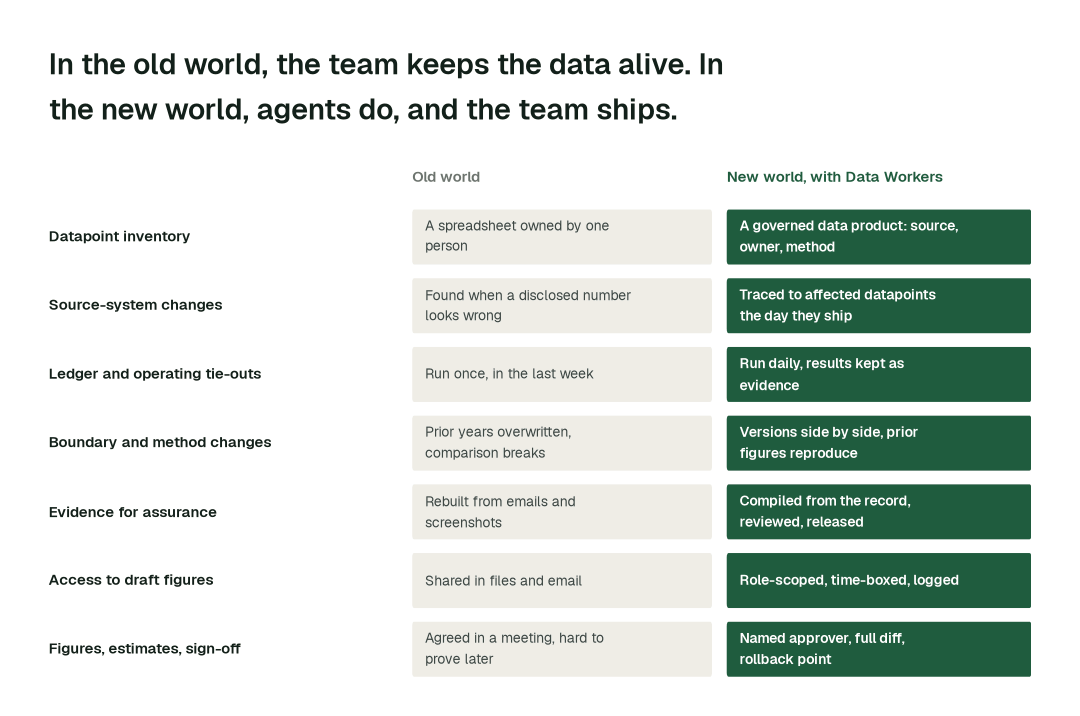
The practices, one by one
1. Keep one inventory of facts, and map every fact to its source
A datapoint is a fact with a definition, unit, period, boundary and owner. A framework paragraph is only a label on it. Build the inventory around the fact and one number serves every regime that asks for it.
Why it's harder than it looks: Frameworks ask for overlapping facts in slightly different forms, so each acquires its own spreadsheet and the spreadsheets drift apart. And the owner of a source system rarely knows it feeds a disclosure, so nobody warns the reporting team when it changes.
- 1.The Data Context & Catalog agent registers each datapoint with
define_business_rule: definition, unit, period, boundary, owner and the framework paragraphs it answers. - 2.It maps the datapoint to its systems, extracts and manual inputs with
trace_cross_platform_lineage, and writes the plain-English page withgenerate_documentation. - 3.
mark_authoritativerecords the trusted source, andflag_documentation_gaplists datapoints still missing an owner, method or control. - 4.The Head of Sustainability Reporting owns the standard (no datapoint without an owner, a source and a control). The sustainability data lead approves each change to a definition.
2. Trace every source-system change to the datapoints it touches, the day it happens
A renamed field is routine for the team that owns the HR system. For the disclosure team it is a possible wrong number in the annual report.
Why it's harder than it looks: Unit changes are the dangerous ones. A site that moves from kilowatt-hours to megawatt-hours gives a figure that is plausible in the total and wrong by a factor of a thousand at the site, and it only shows when somebody compares years in February.
- 1.The Schema Evolution agent runs
detect_schema_changeon each load and says what made the change.list_schema_changeskeeps the history. - 2.
assess_impactandblast_radius_analysislist every datapoint, report and consumer that depends on the changed field or unit. - 3.The Pipeline Building agent drafts the updated staging model with
generate_pipelineand tests it withvalidate_pipeline, including a check that last quarter's published figures still reproduce. - 4.The sustainability data lead receives the full diff and the datapoints affected. Nothing is remapped until she approves.
Across the routine work in this domain, here is the difference in elapsed time:
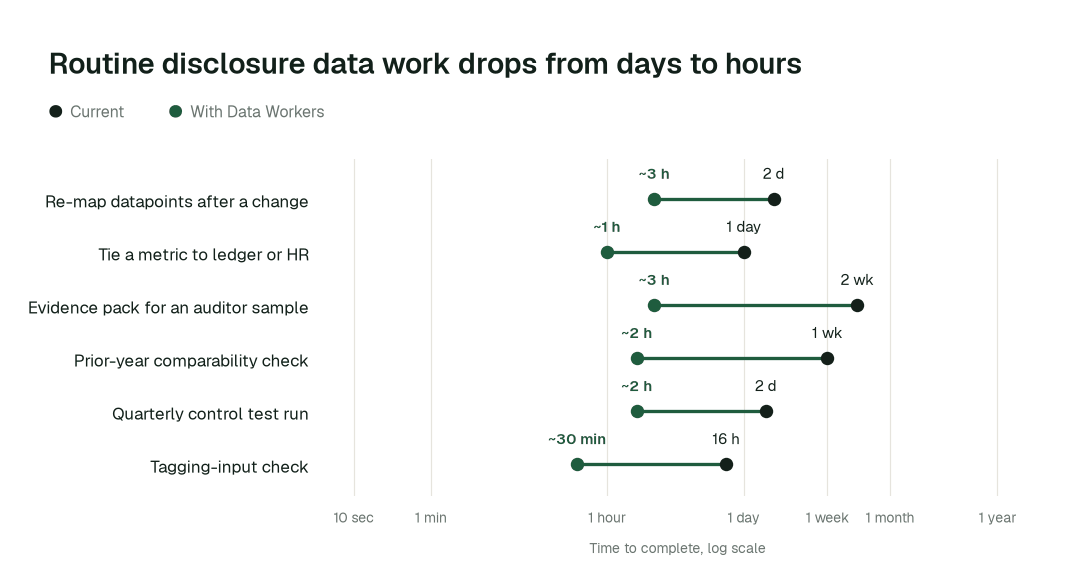
The biggest change is the evidence work: it stops being a project that starts when the auditor calls.
3. Tie every disclosed metric to the ledger or operating system, daily
A tie-out run once is a snapshot. Run daily, it is evidence, and it catches a break while its cause is still one change, not six.
Why it's harder than it looks: Tolerances are judgement. Headcount differs from payroll for good reasons (leavers, contractors, timing), and energy differs from invoices because of billing periods. Most breaks are timing or boundary, not data faults, so a generic alert tells the reviewer nothing. The useful output is a cause with the records attached.
- 1.The Quality Monitoring agent writes the tie-out tests with
create_quality_tests_for_pipeline: headcount to payroll, energy by site to invoices, capital expenditure to the fixed-asset register, revenue exposure to the ledger. - 2.
run_quality_checkruns them every day,set_slaholds the site feeds to a freshness target, andget_quality_summarykeeps the history. - 3.The Incident Debugging agent calls
get_root_causefor every break and names the change behind it, such as a unit switch, a late feed or a cost-centre move. - 4.The sustainability controller decides the tolerance and any accounting treatment. The agents never adjust a figure to make it tie.
This extends the finance pattern in month-end close; for the trace itself, see data lineage for compliance.
4. Version boundaries and methods; never overwrite them
Acquisitions, divestments and method updates change the reporting boundary. The comparison with last year is only credible if the old boundary still exists.
Why it's harder than it looks: The easy fix is to overwrite the entity list and restate. Then last year's published figures can no longer be reproduced, and the auditor's first question, "how do I know last year's number came from last year's scope?", has no answer. Method changes have the same trap.
- 1.The Pipeline Building agent creates a new version of the boundary and method models with
generate_pipeline, leaving the old version in place and testing both withvalidate_pipeline. - 2.The Quality Monitoring agent proves with
run_quality_checkthat the published prior-year figures reproduce under the old version. - 3.The Data Context & Catalog agent records the change in the governed definition with
update_business_rule, with its provenance. - 4.The sustainability lead approves the restated comparatives with the full diff beside the published figures.
5. Compile the evidence pack as the work runs
Assurance should be a review of evidence that already exists, not a search for it.
Why it's harder than it looks: The answers live in different places: the extract in the warehouse, the change in a ticket, the approval in chat, the control test in a spreadsheet. Weeks later, reconstructing them depends on memory, and the sampled datapoint must also explain why this year's number differs from last year's method.
- 1.Every agent action, approval and change lands in a tamper-evident audit trail, which the Observability agent surfaces with
get_audit_trail. - 2.The Data Context & Catalog agent traces each sampled datapoint from source to disclosed figure with
trace_cross_platform_lineage, and the Quality Monitoring agent attaches the latest tie-out withget_quality_summary. - 3.The Data Access & Governance agent assembles the pack with
generate_audit_report. - 4.Internal audit reviews the pack and releases it to the assurance provider. Your assessors decide whether it satisfies the requirement.
See audit-ready sustainability reporting, the audit evidence on demand transformation and audit trail requirements for autonomous data agents.
6. Scope access to draft figures and assurance workspaces
Draft figures before publication can be material, non-public information, and workforce datapoints rest on personal data. The auditor needs support for the sample, not access to everything.
Why it's harder than it looks: Access is granted by ticket and revoked rarely, so an assurance provider keeps broad access long after the engagement, and draft spreadsheets sent by email cannot be recalled.
- 1.The Data Access & Governance agent checks each request against policy with
check_policyand finds the narrowest access that answers it. - 2.
provision_accessrecords a time-boxed grant with an approval, andenforce_rbackeeps reporting, finance, audit and assurance roles apart. - 3.
scan_piifinds personal data in workforce datapoints so evidence packs carry only what the sample needs. - 4.The sustainability data lead approves each grant to the assurance workspace; every grant and revoke is logged.
7. Hold every figure, estimate and conclusion for a named owner
Speed matters for reversible work. For anything that becomes a disclosed figure or a judgement, accountability matters more.
Why it's harder than it looks: Either everything waits for review and the benefit disappears, or a fix goes straight through and is reversed after someone asks why the number moved. The workable rule separates reversible upkeep (documentation, staging fixes, reruns) from work that shapes a disclosed figure, and never lets the preparer approve. Estimates and methodology choices are judgements no agent should make.
- 1.The Data Access & Governance agent assembles each proposal that feeds a disclosed figure, with evidence, lineage and datapoints affected, and calls
request_governance_review. - 2.The Autonomous Data-Conductor checks that downstream numbers still hold and routes one decision to the named owner.
- 3.The sustainability lead or the CFO approves or declines. Unanswered requests expire and escalate, and the highest-risk changes need a second approver who is not the requester (how approvals work).
- 4.A person confirms the figure and publishes it through your reporting and tagging tools. No agent concludes, approves or files.
By task class, the balance looks like this:
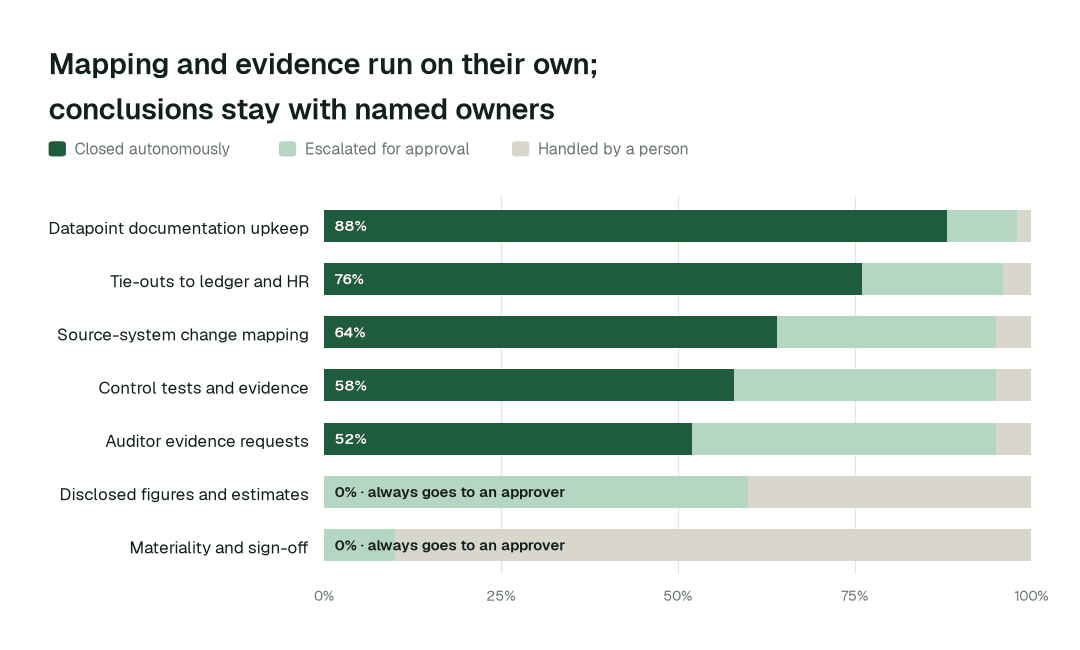
Datapoint documentation upkeep closes autonomously 88% of the time. For materiality conclusions and sign-off, autonomous closure is 0% by design.
Designing the autonomy ladder
Autonomy is set per task class, not per tool. L0 is manual, L1 observes, L2 proposes, L3 acts reversibly and L4 runs on its own (the levels in full). Every deployment starts at L1. L0 to L2 run today; L3 and L4 are where a domain can go on evidence, never on a date. A class that feeds a disclosed figure stops at L2.
| Task class | L0 | L1 | L2 | L3 | L4 |
|---|---|---|---|---|---|
| Datapoint documentation upkeep | Today | Today | Today | On evidence | On evidence |
| Source-system change detection and impact | Today | Today | Today | On evidence | Not set |
| Daily tie-outs and control test runs | Today | Today | Today | On evidence | Not set |
| Evidence pack assembly | Today | Today | Today, reviewer releases | On evidence | Not set |
| Mapping changes, boundary versions and restated comparatives | Today | Today | Ceiling | Never | Never |
| Materiality, methodology, estimates, sign-off | Always | Never | Never | Never | Never |
The operating model: who owns what
Agents change who does the work, not who is accountable for it:
| Role | Owns | What the agents take off their plate |
|---|---|---|
| Head of Sustainability Reporting | The datapoint standard, autonomy levels per domain and which topic goes next | Chasing owners, keeping the inventory current |
| Sustainability data lead | Mapping changes, boundary versions and assurance workspace access | Preparing the diff, blast radius and rollback plan for each proposal |
| Sustainability controller and internal audit | Tie-out tolerances, control tests and evidence release | Running tie-outs, tracing breaks, assembling the pack |
| CFO, sustainability lead and audit committee | Materiality, methodology, estimates, disclosed figures and sign-off | Nothing that needs judgement; they get better evidence for it |
| Data engineers | Reviewing proposals and building new datapoints | Remapping staging models after each system change |
The swarm behind the practices
No single agent delivers these practices. Each one is a hand-off between specialists, coordinated under the autonomy you set per domain.
| Agent | What it does on disclosure data | Tools it calls |
|---|---|---|
| Connectors and Data Ingestion | Land ERP, HR, energy and supplier feeds and confirm every load | get_connector_status, get_dbt_run_history, get_dbt_test_results |
| Schema Evolution | Detects renamed fields, changed units and new codes in source systems | detect_schema_change, list_schema_changes, assess_impact |
| Pipeline Building | Builds and versions the mapping, boundary and calculation models, with tests | generate_pipeline, validate_pipeline |
| Quality Monitoring | Ties each disclosed metric to the ledger or operating system, and keeps results | create_quality_tests_for_pipeline, run_quality_check, set_sla, get_quality_summary |
| Incident Debugging | Traces a variance in a disclosed metric to the change that caused it | diagnose_incident, get_root_cause |
| Data Access & Governance | Scopes and logs access to drafts and evidence, and compiles the report | check_policy, provision_access, enforce_rbac, scan_pii, request_governance_review, generate_audit_report |
| Data Context & Catalog | Documents the inventory with owner and lineage, and finds what a change touches | define_business_rule, update_business_rule, trace_cross_platform_lineage, blast_radius_analysis, generate_documentation |
| Observability | Provides the audit trail of what agents and people changed | get_audit_trail |
Data Context Wizard holds one governed definition of each datapoint, unit and reporting boundary, so the report, the model and the evidence pack never disagree. Autonomous Data-Conductor verifies the numbers that matter before internal audit sees them. Spellbook Data Catalog (in preview) makes each datapoint and its sources discoverable in plain English.
What disappears
The clearest sign the practices are working is what stops happening:
- •The February rebuild of support for a sampled datapoint.
- •The thousand-fold figure found after the draft has circulated.
- •A prior-year comparison that no longer matches what was published.
- •The inventory spreadsheet that only one person understands.
- •Draft figures in email, and assurance access that outlives the engagement.
The point is not any single agent. It is that the disclosure data back office keeps running between reporting dates. Changes are caught where they enter, not where a number is read, and every action leaves a signed receipt, so the team can see what happened and roll it back.
A Head of Sustainability Reporting's scorecard
If you own the data under the sustainability statement, these are the metrics to set as targets and bring to every quarterly review:
- •Datapoints with an owner, source, method and control (target: every in-scope datapoint)
- •Re-mapping after a source-system change (targeting ~3 h, from about 2 days)
- •Days per quarter disclosed metrics tie to the ledger and operating systems
- •Auditor sample request answered (targeting ~3 h, from about 2 weeks)
- •Comparability check after a boundary change (targeting ~2 h, from about a week)
- •Documentation upkeep closed autonomously (targeting 88% as the deployment matures)
- •Disclosed figures and conclusions with a named approver on record (target: all of them)
Where this goes next
The same inventory serves the next framework or jurisdiction, because a new regime adds datapoints and a mapping, not a new spreadsheet and a project team. For upstream inputs, see the climate and sustainability data playbook and supplier ESG data. For the sister team at banks and insurers, see best practices for agentic risk and regulatory reporting data. As each class builds a review record, you decide which moves up the ladder.
The climb: from assisted to autonomous to agentic
Our thesis is that the data platform climbs the way analytics did, in stages, and that the hard part of data work was never knowing what to do but doing it. For regulatory disclosure data teams, the climb looks like this:
- •Assisted. Agents read the whole stack, map datapoints to source and propose every fix with a receipt; anything that feeds a disclosed figure goes to a named approver.
- •Autonomous, under your governance. Routine work runs on its own: system changes traced to datapoints, daily tie-outs, scheduled control tests and evidence. Your team governs the agents instead of doing the upkeep.
- •The agentic enterprise. A disclosure data team that arrives at every reporting date with a tied datapoint set and an evidence pack. People make the judgements and sign; the platform carries out the rest.
You choose the altitude, every step is visible and reversible, and the pilot below is the first rung.
The pilot: how regulatory disclosure data teams start
The pilot is how your team proves the value on its own data before committing.
- •Scope. One disclosure topic, for example energy and workforce datapoints, mapped, tied and evidence-packed at L2. We connect your ERP and ledger, HR and payroll, energy data, warehouse, dbt and orchestrator over MCP, inside your environment. Nothing migrates.
- •First week. Agents run at L1. They map every datapoint to its source and show the fixes they would have made, with receipts, before anything changes.
- •By week two. Change tracing, daily tie-outs and documentation start running on reversible work. Anything that feeds a disclosed figure stays at L2 with a named approver.
- •At day 30. We review the impact metrics against your baseline, and you decide whether to expand to the next topic or framework:
- •Datapoint re-mapping after a system change: from about 2 days to ~3 h
- •Auditor sample request answered: from about 2 weeks to ~3 h
- •Comparability check after a boundary change: from about a week to ~2 h
- •the share of documentation upkeep closed autonomously, targeting 88% as the deployment matures
- •Guarantee. In a 90-day pilot, ten engineering hours per data engineer per week are recovered against a baseline both sides sign on day one, or the $7,500 fee is refunded.
- •Cost. Start with a pilot ($7,500 one-time, a 6 to 12 week pilot, credited in full against the first year). Scale is from $1,000 a month and Enterprise from $3,000 a month, billed annually, with unlimited seats, no usage meter and no markup on model spend. See pricing.
The pilot is the start of a longer curve:
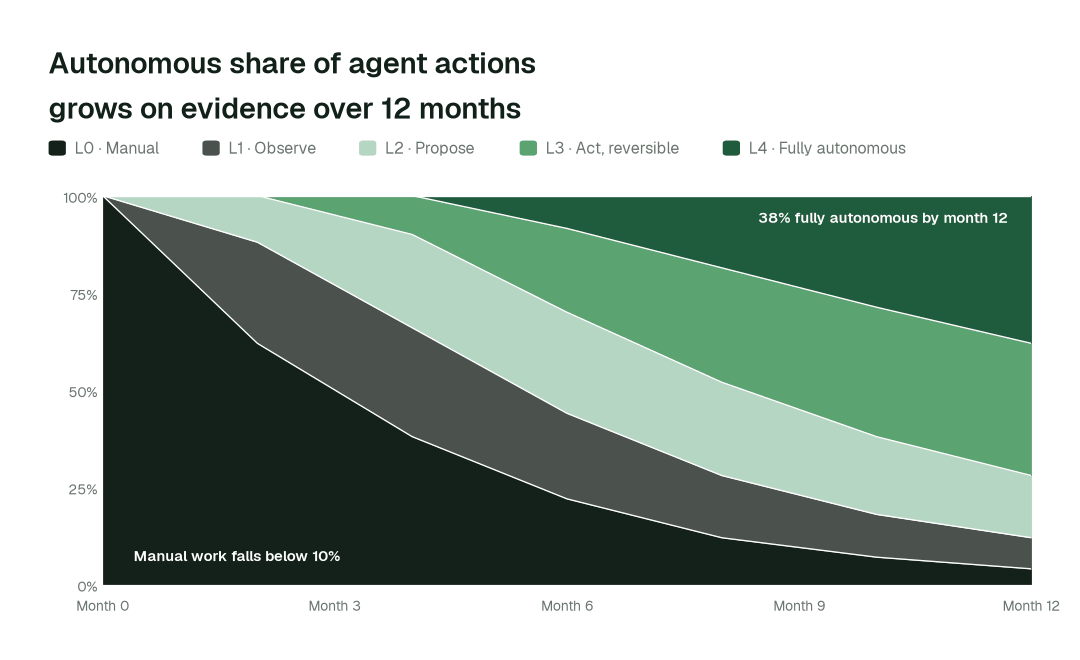
By month 12, more than 38% of agent actions run fully autonomously and manual work falls below 10%, while disclosed figures, conclusions and sign-off stay with named owners.
Data Workers does not make you compliant with CSRD, ESRS, ISSB, California law or any other regime; your controls, people, advisers and assessors do. Not legal advice.