Best practices for agentic data coverage, accuracy and evaluation: a field guide for data evaluation teams
A data business is judged on the numbers it quotes about its own product: coverage, fill rate, accuracy, freshness and match rate. This field guide shows how to measure and prove them with agents, practice by practice. It covers how to define each metric once, keep truth sets honest, score by segment, check every release before customers do, run a fair prospect bake-off in hours and re-measure every published figure, while a named person approves each number that leaves the building.
If your company sells data, your quality numbers are part of the product. Prospects ask for a benchmark on their own sample before they buy, often from two or three vendors at once. Customers compare coverage and accuracy at renewal. A figure in a deck or questionnaire is a representation to a buyer, and sometimes a clause in a contract.
The mandate for a Head of Data Quality or Evaluation is to know on any day how good the product is and to prove it by Friday. The trap is that the measuring grows faster than the team. Every prospect sample, release and deck revision is another run of the same six metrics, rebuilt by hand with whatever definition the analyst remembers, so the week goes to reproducing numbers instead of improving coverage and accuracy.
Our view: measurement is repeatable work, so agents should do it, and what a number means and whether it leaves the building are decisions for people. This field guide is the companion to the team playbook. It follows a number from its definition to the customer who reads it and tests each practice against one question: does the quality you quote match the quality you deliver?
The old world
It is Wednesday afternoon. A sales engineer forwards a prospect's sample file, six fields to benchmark and a Friday deadline. An analyst profiles it by hand, runs it through the product in a one-off notebook and calculates fill rate with the definition she remembers from last time. The file has duplicates and four postcode formats, and nobody separates those from the product's gaps. Meanwhile a mapping change shipped last week and fill rate on one field fell in two regions, but the dashboards watch pipeline health, which is green. On Monday a customer asks why those fields are empty. The deck says 94% of companies have an industry code, the data sheet says 92% and the last security questionnaire says "over 90%". All three were true once.
The new world
Same week with Data Workers. The Data Ingestion agent profiled the prospect's file on arrival and the Pipeline Building agent ran it through the path customers' data takes. Data Context Wizard supplied the governed definition of each metric, and the Quality Monitoring agent separated the file's own defects from the product's gaps. The mapping change was compared with the last release before it shipped, and the field that moved was flagged on the candidate with the affected feeds listed. Autonomous Data-Conductor held both for their owners. The evaluation lead approved the bake-off report on Thursday morning, rewrote one caveat in her own words and sent it.
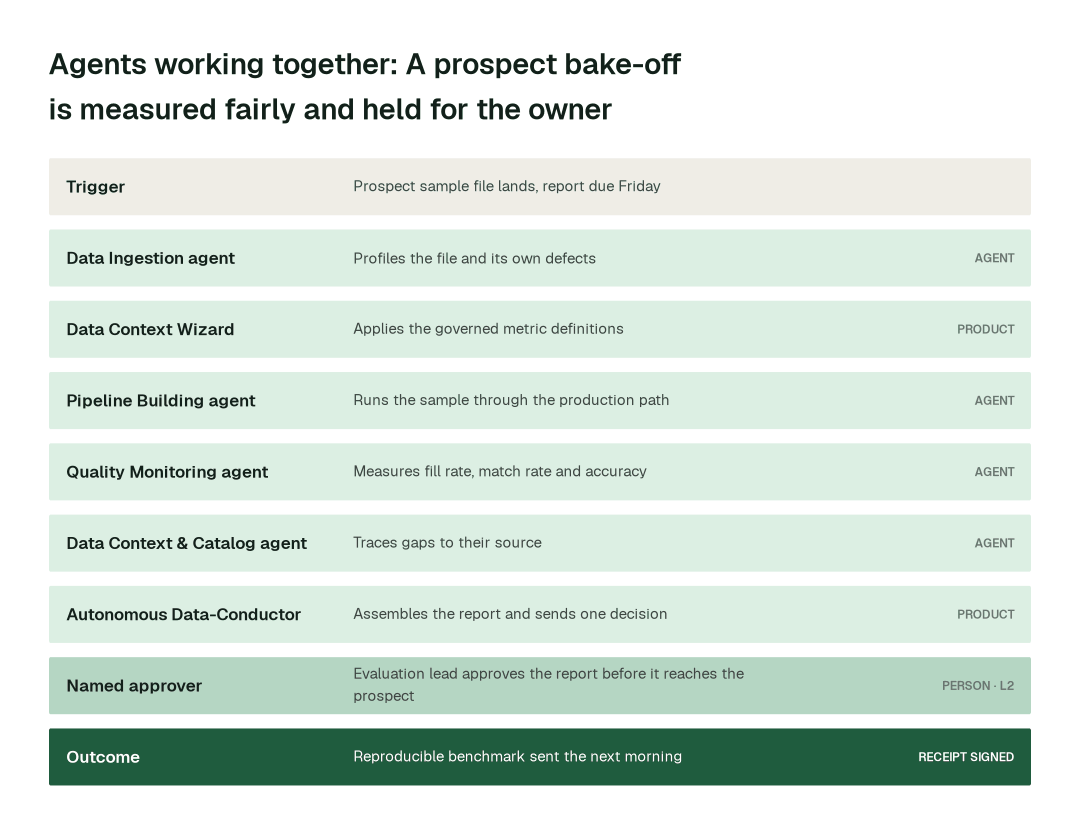
The rest of this report walks through the 7 practices that make that week possible. At a glance:
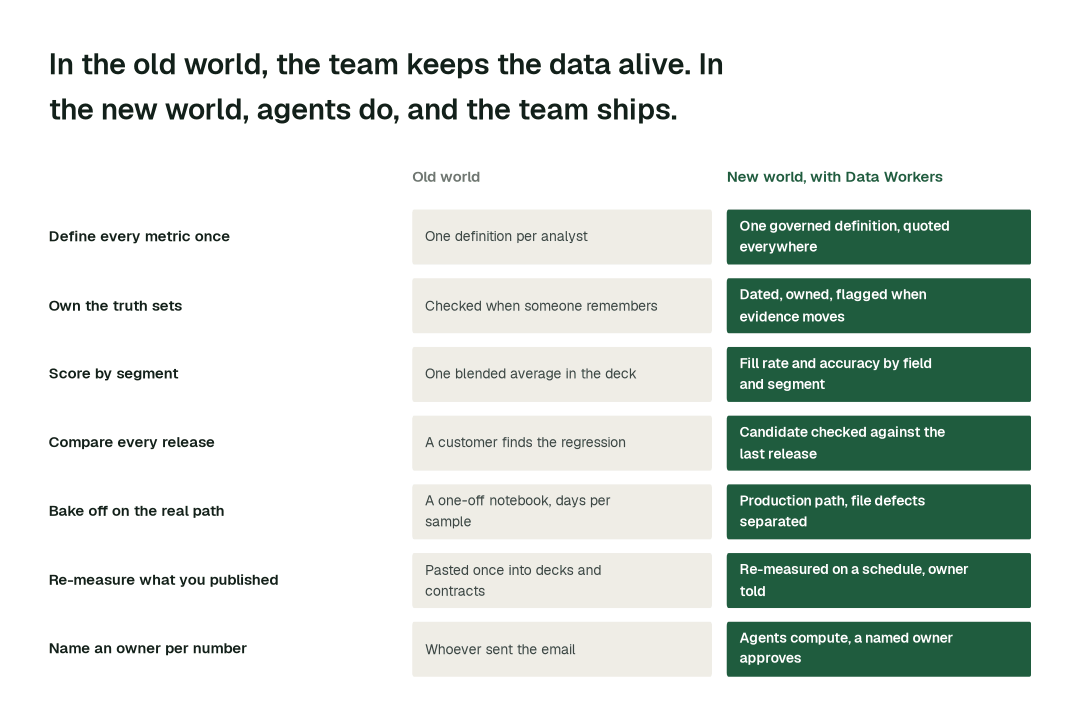
The practices, one by one
1. Define every metric once, in writing
Fill rate, match rate, accuracy, coverage and freshness each have several defensible definitions. Fill rate can count blanks or also invalid values. Match rate can be per record or per entity. Whichever you choose, every report must use it.
Why it's harder than it looks: the definitions live in analysts' heads and in the notebook each last used. Two people get two answers from the same data, and the discrepancy surfaces in front of a prospect. Agreeing definitions is the easy half; making every report, deck and contract use them is the work.
- 1.The Data Context & Catalog agent lists the metrics your company already quotes and calls
list_semantic_definitionsto see which have a definition on record. - 2.Where one is missing or has several,
define_business_rulerecords a single definition: the denominator, the treatment of blanks and invalid values, and the unit. - 3.
mark_authoritativemakes it the source every report reads, andresolve_metricreturns it, so the scorecard, a bake-off and a contract clause quote a number the same way. See build your semantic layer. - 4.
generate_documentationwrites the plain-English page for each metric. The Head of Data Quality approves every new or changed definition, because what counts as a filled field or a match is a commercial decision.
2. Treat truth sets as products with an owner and a date
Accuracy is only as good as the reference it is measured against. Companies move, people change jobs and places close, so an old truth set flatters or punishes the product by an amount nobody knows.
Why it's harder than it looks: the truth set is usually a file on a shared drive with no owner, no refresh date and no record of which numbers it produced. Relabelling is slow, so it waits, and the staleness stays invisible until a customer's own check disagrees.
- 1.The Data Context & Catalog agent documents each truth set with
generate_documentation: coverage, who labelled it, when, and which published numbers depend on it. - 2.
check_stalenessandflag_stale_contextmark records that disagree with fresher evidence, such as a supplier's latest delivery, and say where to look. - 3.
trace_cross_platform_lineagelists the reports and deck figures that would move if a record changed. - 4.The truth-set owner reviews the flagged records and relabels what needs it. Agents never change the reference they are measured against.
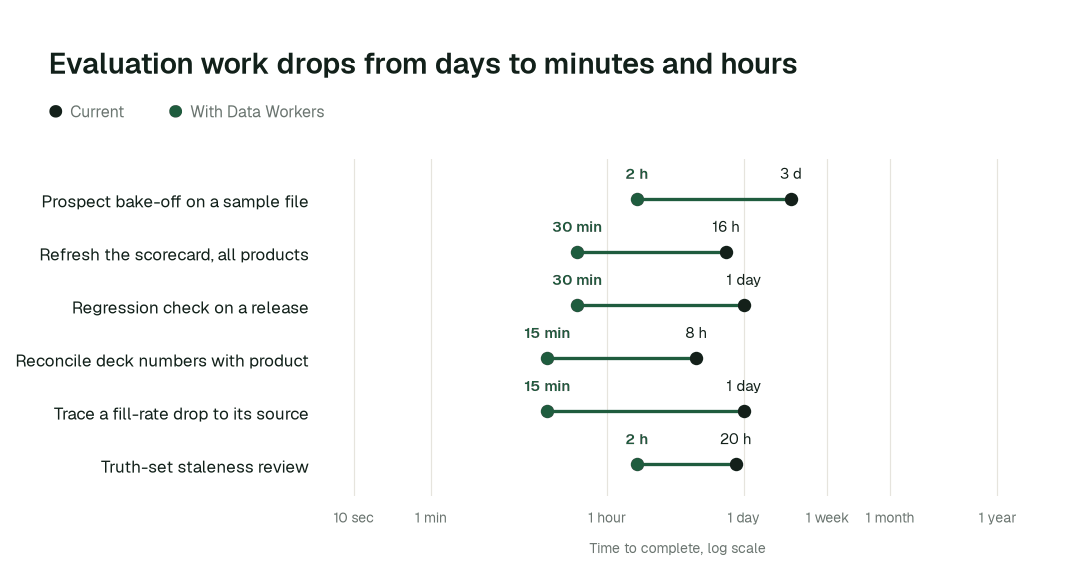
Practices like these compound. Across the routine work they cover, here is the difference in elapsed time:
3. Score the product by segment, not by the average
A blended average can hide a weak segment. A prospect's file is rarely the average: it is mostly micro-businesses, or one country, or one industry. With only the blended figure, you cannot predict how the product will do on their data.
Why it's harder than it looks: the blended number is one query. By segment, region and field it is hundreds of cells, each needing enough labelled records to mean anything, so teams quote the average.
- 1.The Quality Monitoring agent runs
run_quality_checkfor fill rate by field, region and segment against the governed definitions, and coverage against the universe you claim. - 2.
get_quality_scoreandget_quality_summaryroll the cells up and mark those where the sample is too small to quote. - 3.
get_anomalieswatches each cell against its own normal behaviour, so a slip in one region is a flag even when the blended number holds. - 4.The data product owner picks which gaps to close and hands each to the team that owns the fix: data acquisition for coverage, entity resolution for match rate.
4. Compare every release with the last one before it ships
A mapping change or a matching tweak can lower a fill rate in one region while every pipeline stays green. Observability says the pipeline is healthy, not that the product got worse (how the two differ).
Why it's harder than it looks: a release comparison needs the last release's measurements kept, a definition that did not change in between and a list of what each field feeds. Most teams have none of the three, so the comparison happens after a customer asks.
- 1.The Pipeline Building agent calls
validate_pipelineon the candidate, andcreate_quality_tests_for_pipelineadds checks for the fields it changes. - 2.The Quality Monitoring agent runs
run_quality_checkon the candidate and compares fill rate, coverage and accuracy with the last release, flagging movement withget_anomalies. - 3.
blast_radius_analysislists the products and customer feeds that carry the field that moved. The Incident Debugging agent callsget_root_causeto trace it to the mapping, supplier or release behind it. - 4.Autonomous Data-Conductor holds the release and sends the data product owner one decision with the evidence: promote, fix or promote with a coverage note. See the quality monitoring agent for how the checks work day to day.
5. Run bake-offs on the production path and separate the file from the product
A prospect's sample is skewed to their segment and carries duplicates and invalid values of its own. An unqualified comparison blames the product for the file, and a one-off notebook measures something other than what customers receive.
Why it's harder than it looks: being fair to both sides takes days. The shortcut is to run the sample through whatever is quickest, which is rarely the matching and enrichment path production uses, so the result cannot be reproduced.
- 1.The Data Ingestion agent lands the file inside your environment and profiles it: rows, duplicates, empty fields and formats. The prospect's data stays in your infrastructure.
- 2.The Pipeline Building agent uses
generate_pipelineandvalidate_pipelineto run the sample through the path customers' data takes, as a reviewed change. - 3.
resolve_metricsupplies the definitions, and the Quality Monitoring agent runsrun_quality_checkfor fill rate per field, match rate and agreement with your truth set and any labels the prospect supplies, with and without the file's own defects. - 4.
get_quality_summarydrafts the report with its method, caveats and what could not be measured. The evaluation lead approves or edits it before it reaches the sales engineer.
6. Re-measure every number you have published
A figure was true when it was pasted into the deck, the data sheet and the questionnaire. After that nobody owns re-measuring it, so the three drift apart and from the product.
Why it's harder than it looks: nobody knows where the numbers are: slide decks, PDFs, RFP answers, questionnaires and contracts, with the definition behind each usually lost. A contract commitment such as a freshness or completeness term is the costly case, since a miss can mean a service credit (data quality SLA examples).
- 1.The team lists every published figure, and the Data Context & Catalog agent ties each to a governed definition and a product with
resolve_metricanddefine_business_rule. - 2.On a schedule and after each release,
run_quality_checkre-measures them against the live product, andcheck_freshnesscompares delivery against the promise (freshness SLAs). - 3.
set_slarecords contract commitments so each delivery is checked against them. Writing them in an open format such as the Open Data Contract Standard keeps them readable by people and agents (how agents enforce data contracts). - 4.When a measured value moves outside the tolerance the owner set, Conductor sends the owner one decision: update the material or investigate the product.
7. Put a named owner on every number that leaves the building
Speed is the point of the other six practices, and it is also the risk. A report to a prospect, a figure in a contract or a label in the truth set carries accountability outside the data team. A number nobody approved is a claim no person decided to make.
Why it's harder than it looks: the choice is usually everything waiting on review or everything going straight out. Routing by class fixes it: reversible measurement runs on its own, and only numbers that leave the building wait for a named person, with the evidence attached.
- 1.The Data Access & Governance agent keeps prospect files and truth sets inside the access you set with
check_policyand flags personal data withscan_pii. For person data, accuracy is also a legal principle: the GDPR requires it to be accurate and, where necessary, up to date (Article 5(1)(d)). - 2.Every proposed figure arrives with its definition, sample, query and run, so the owner can re-run it.
- 3.
request_governance_reviewroutes numbers for prospects, contracts and questionnaires to the named owner. - 4.
generate_audit_reportrecords who proposed each number, who approved it and when, so a disputed figure traces to the run behind it and the correction reaches everyone who received it.
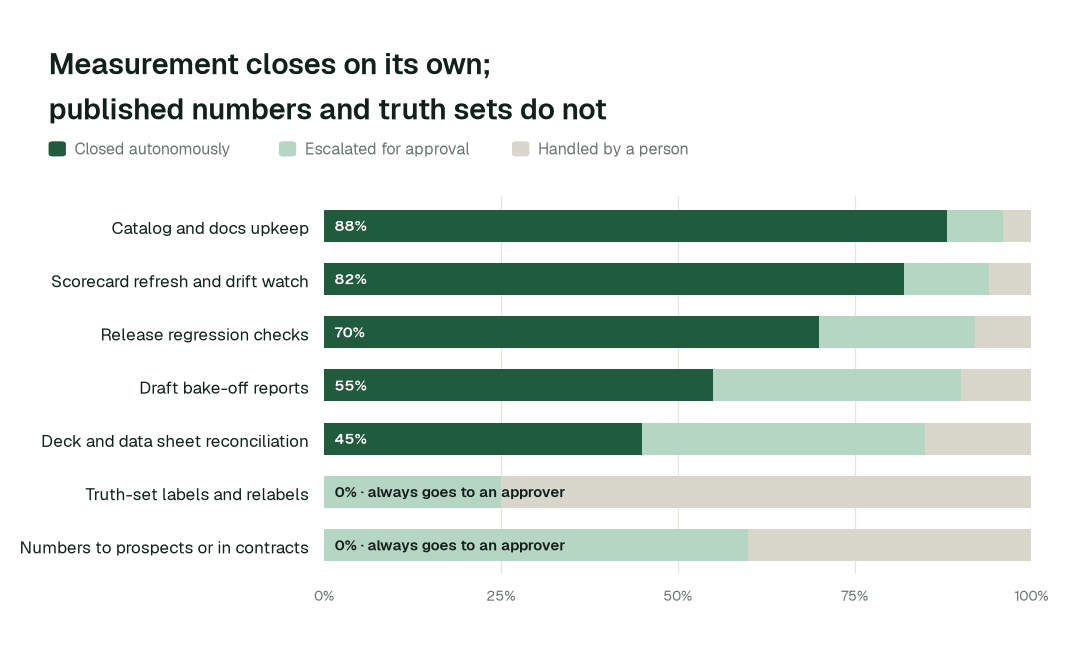
By task class, measurement runs on its own and published numbers do not:
Designing the autonomy ladder
Autonomy is set per task class and per product. L0 is off, L1 observes, L2 proposes and a person approves, L3 acts reversibly with a rollback point, L4 is fully autonomous. Every product starts at L1. L0 to L2 run today. L3 and L4 are where a domain can go on the evidence of its own review record ("On evidence" below), never by a date. See the autonomy ladder.
| Task class | L0 | L1 | L2 | L3 | L4 |
|---|---|---|---|---|---|
| Metric pages, definitions and lineage upkeep | Off | Shows gaps | Proposes updates | On evidence | On evidence |
| Scorecard refresh and drift watch | Off | Reports on request | Proposes flags | On evidence | On evidence |
| Release comparison before promotion | Off | Compares and reports | Proposes hold or promote | On evidence | Rarely |
| Draft bake-off reports | Off | Profiles the file | Drafts for the evaluation lead | Rarely | No |
| Truth-set labels and relabels | Off | Flags stale records | Proposes where to look | No | No |
| Metric definition changes | Off | Shows the effect | Proposes to a named approver | No | No |
| Numbers to prospects or in contracts | Off | Evidence only | Evidence to a named owner | No | No |
The operating model: who owns what
Agents change who does the work, not who is accountable for it:
| Role | Owns | What the agents take off their plate |
|---|---|---|
| Head of Data Quality or Evaluation | Metric definitions, autonomy per product, which gaps to close | Status, rebuilding comparisons, answering "how is this calculated" |
| Evaluation analysts | Truth-set labels, method and caveats | Profiling samples, recomputing metrics, assembling reports |
| Data product owner | Release holds and quality commitments in contracts | Tracing which feeds and customers a regression reaches |
| Data engineers | Reviewing agent proposals, fixing the cause | Reruns, mapping diffs and documentation |
The swarm behind the practices
No single agent delivers these practices; each one is a hand-off between specialists under the autonomy you set per product.
| Agent | What it does on an evaluation team | Public tools it calls |
|---|---|---|
| Connectors and Data Ingestion | Land samples, truth sets and supplier files, profile every load, run your existing test suites | get_connector_status, run_gx_suite, run_soda_suite, get_dbt_test_results |
| Pipeline Building | Build and validate measurement and comparison pipelines as reviewed changes | generate_pipeline, validate_pipeline, deploy_pipeline |
| Quality Monitoring | Compute fill rate, accuracy and freshness, compare releases and watch for drift | run_quality_check, get_anomalies, get_quality_score, get_quality_summary, set_sla, create_quality_tests_for_pipeline |
| Incident Debugging | Trace a coverage or fill-rate drop to its cause | diagnose_incident, get_root_cause |
| Data Context & Catalog | Document each metric and truth set, with lineage and an authoritative source | resolve_metric, define_business_rule, mark_authoritative, check_staleness, trace_cross_platform_lineage, blast_radius_analysis |
| Data Access & Governance | Keep samples inside the access you set and record every use | check_policy, scan_pii, request_governance_review, generate_audit_report |
Data Context Wizard holds one governed definition of every metric your company sells, so the scorecard, a bake-off, the data sheet and the contract quote the same number. Autonomous Data-Conductor verifies the outcomes that matter before a report goes to its owner and before a release is promoted. Spellbook Data Catalog gives each product, truth set and metric a plain-English page: how it is defined, when it was last checked and who owns it.
What disappears
- •The customer who finds the regression before you do.
- •The bake-off notebook nobody can reproduce.
- •Three fill rates for the same field in three documents.
- •The truth set nobody has checked since its author left.
- •The deck figure that was true in March.
What replaces them is quieter: every number has a definition, a sample and a run behind it, regressions are held on the candidate, and every action leaves a signed receipt you can roll back.
A Head of Data Quality's scorecard
Targets to bring to each quarterly review, not results:
- •Prospect bake-off turnaround: target about two hours, from about three days.
- •Release regression check: target about 30 minutes, from about a day.
- •Fill-rate drop traced to its source: target about 15 minutes, from about a day.
- •Regressions found by a customer before you: target zero, with each held release on record.
- •Published figures re-measured on schedule, with an owner: target every figure in a deck, data sheet or contract.
- •Upkeep closed autonomously, and its token cost: targeting 88% for catalog and docs upkeep as the deployment matures.
Where this goes next
Measurement sits beside the teams that move the numbers: sourcing raises coverage, entity resolution sets match rate and data delivery and feeds decides what a customer receives. All of them are gathered on the data businesses page. For the wider pattern of automating checks across a platform, see data quality on autopilot and the complete guide to data quality.
The climb: from assisted to autonomous to agentic
Our thesis is that the data platform climbs the way analytics did, in stages, and that the hard part was never knowing what to do but doing it. For data coverage, accuracy and evaluation teams:
- •Assisted. Agents read your products and truth sets, show where the scorecard is thin and propose every report with its evidence; every published number goes to a named owner.
- •Autonomous, under your governance. Routine work runs on its own: the scorecard is recomputed on every release, candidates are compared with the last release and metric pages stay current.
- •The agentic data business. An evaluation function that decides what good looks like and which gap to close next, while the numbers in every deck, contract and feed track what the product delivers.
The pilot: how data coverage, accuracy and evaluation teams start
The pilot proves the value on your own data.
- •What we connect. Snowflake or Databricks, dbt, Airflow or Dagster, your test suites, truth sets and delivery layer, over MCP, inside your infrastructure. Nothing migrates.
- •Scope. Bake-off preparation on your next two prospect samples, plus a regression check on one product's next release, at L2.
- •First week. Agents run at L1 on the scoped product. They map lineage, document the metrics you already quote and show where today's published figures differ from the product, before anything changes.
- •By week two. Scorecard refresh and documentation upkeep run on reversible work. Bake-off reports, deck figures and anything that leaves the building stay at L2 with a named owner.
- •At day 30. We review the impact metrics against your baseline:
- •Prospect bake-off: from about three days to ~2 h
- •Release regression check: from about a day to ~30 min
- •Fill-rate drop traced to its source: from about a day to ~15 min
- •catalog and docs upkeep closed autonomously, targeting 88% as the deployment matures
- •What you decide. Whether to expand to the next product.
- •Guarantee. In a 90-day pilot, ten engineering hours per data engineer per week recovered against a baseline both sides sign on day one, or the $7,500 fee is refunded.
- •Cost. Start with a pilot ($7,500 one-time, a 6 to 12 week pilot, credited in full against the first year). Scale is from $1,000 a month and Enterprise from $3,000 a month, billed annually, with unlimited seats, no usage meter and no markup on model spend. See pricing.
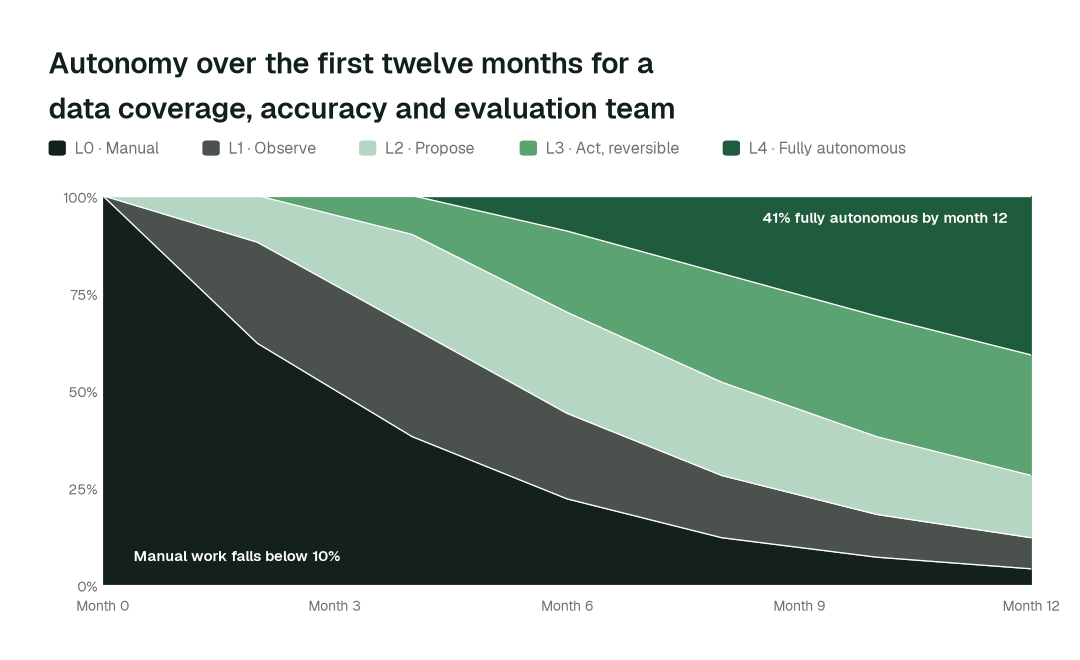
By month 12, more than 40% of agent actions run fully autonomously and manual work falls below 10%, while published numbers and truth-set labels stay with a named owner.