DER and grid planning data, run by agents
Feeder load forecasts and hosting-capacity studies depend on the interconnection queue, the GIS and the AMI reads agreeing with each other, and they rarely do. Planners spend the first weeks of every study reconciling inputs instead of studying the grid. Here is how Data Workers runs it instead.
Key takeaways
- •The problem today. Distributed energy resource (DER) requests for solar, EV charging and storage arrive faster than planners can tie them to a feeder. The queue, GIS and AMI reads describe the same circuit differently, so every study starts with reconciliation.
- •What changes. Agents check queue, GIS and AMI inputs against each other as they change, and show which forecasts and hosting-capacity results a change touches.
- •What stays with your people. A feeder-mapping correction or a study input is a proposal. The distribution planning lead approves it.
- •The result. Studies start from inputs that agree, and every adjusted input carries its reason and its approver.
The problem today
A rooftop solar request names a service address. The queue tool holds it against a premise, the GIS holds the transformer and feeder that serve it, and the meter data system maps the meter to a transformer that was true on install day. When these disagree, the array lands on the wrong feeder, and that feeder's load forecast and hosting-capacity result are wrong with it.
Queues are moving toward grouped, dated studies. FERC's Order No. 2023 requires transmission providers to study new generators in clusters, with deadlines. It covers transmission-level generation, but the lesson carries: fixed windows leave no room for a week of cleanup first. EV chargers and batteries also add load shapes the history never saw. This is the planning side of the week in the playbook for utility data teams.
What changes with Data Workers
Agents work alongside your queue tool, GIS and planning software, which stay the systems of record. They read the queue extract, the GIS export and the interval reads as they land, and learn what normal looks like for each feeder: its service points, its load shape and how fast its DER count grows.
When an input moves, the agents say what else moves with it. A reclassified transformer, a renamed feeder or a premise that changed hands shows up with the studies and forecasts it affects, with a proposed correction for the owner. The operations and supply chain data teams that run billing, outage and planning from one dataset share this foundation, and the field guide for utility data teams covers the meter side. The energy and utilities platform view covers the stack.
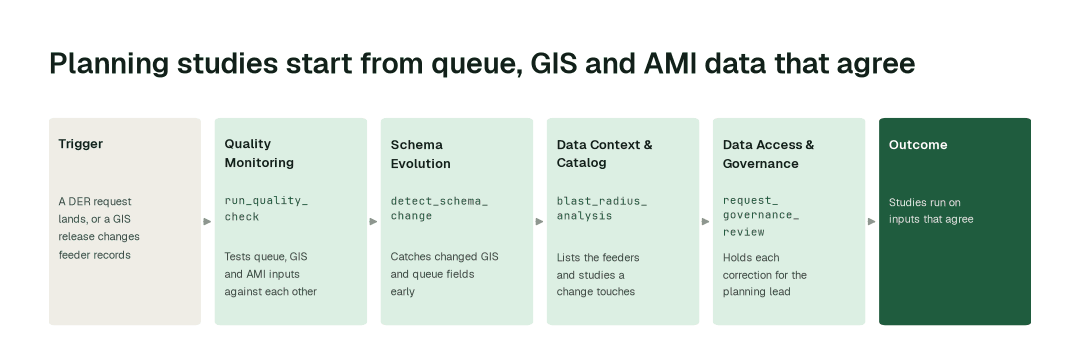
The workflow, step by step
- 1.The Quality Monitoring agent calls
run_quality_checkand tests each queue extract, GIS export and feeder load series for orphaned service points, duplicate requests and loads that no longer fit their assigned feeder. - 2.The Schema Evolution agent calls
detect_schema_changeand catches a new GIS release, a queue export with renamed fields or a status code that changes meaning, before the forecast job reads it. - 3.The Data Context & Catalog agent calls
blast_radius_analysisand lists the feeders, load forecasts, hosting-capacity results and open studies that depend on the input that moved. - 4.The Data Access & Governance agent calls
request_governance_reviewand puts each proposed mapping correction or adjusted input in front of the planning lead, with a preview and how to undo it.
The impact metrics we move
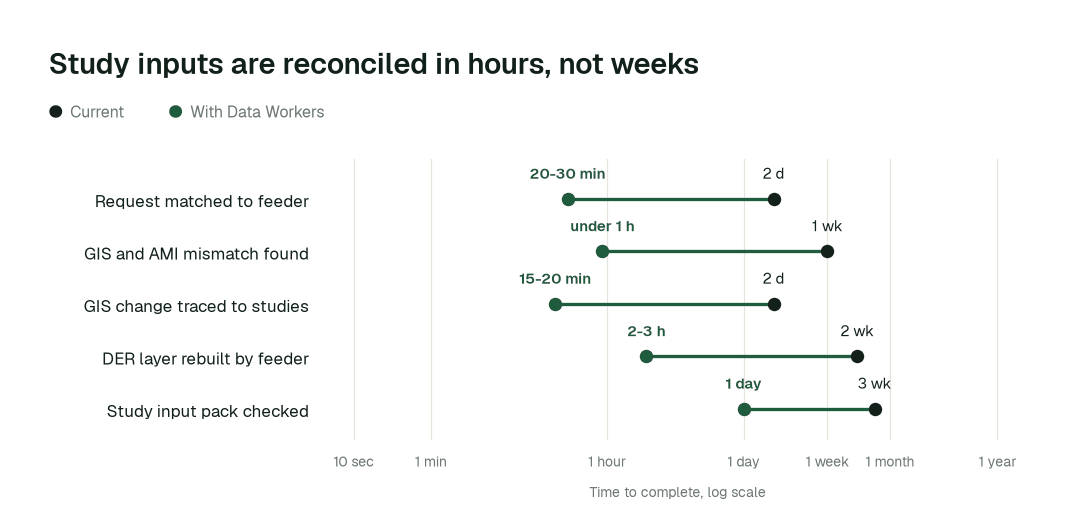
- •Interconnection request matched to its feeder and transformer: from about 2 days to 20-30 min
- •GIS and AMI feeder mismatch found: from about 1 week to under 1 h
- •GIS change traced to the studies it affects: from about 2 days to 15-20 min
- •Solar, EV and storage adoption layer rebuilt by feeder: from about 2 weeks to 2-3 h
- •Study input pack assembled and checked: from about 3 weeks to 1 day
What goes on autopilot
- •Every queue and GIS extract is checked on arrival, so a duplicate request or an orphaned service point is flagged the day it appears, not in the middle of a study.
- •Feeder, transformer and premise records stay documented in the catalog, each with an owner and an authoritative source, so planners know which copy to trust.
- •Adoption counts refresh on a schedule, so solar, EV and storage by feeder are current when a forecast runs.
Where your people stay in charge
A feeder mapping decides where a customer's generation or charger is counted, and a study input shapes what the utility says it can host or must build. Each correction and each adjusted input goes to a named approver: the distribution planning lead, with the GIS owner for any change to the GIS. The agents propose; the fix is made in the system that owns the data, and the approval is recorded in a tamper-evident audit trail with a signed record of what ran (how approvals work). Study methods, hosting-capacity criteria and regulator filings stay with your engineers. Everything starts at L1, observing only, and autonomy rises only on evidence.
The pilot
- •Scope. Queue, GIS and AMI consistency checks on one substation area or one circuit group, with corrections held at L2.
- •First week. Agents run at L1, observing only, and show the mismatches they would have flagged, with receipts.
- •By week two. Arrival checks and impact tracing run on their own; every correction and adjusted input goes to the planning lead.
- •At day 30. We review the impact metrics against your baseline:
- •GIS and AMI feeder mismatch found: from about 1 week to under 1 h
- •Study input pack assembled and checked: from about 3 weeks to 1 day
- •Cost. Start with a pilot ($7,500 one-time, credited in full against the first year). Scale is from $1,000 a month and Enterprise from $3,000 a month, billed annually, with unlimited seats, no usage meter and no markup on model spend. See pricing.