Agentic data coverage and accuracy: a guide for evaluation teams
Going fully agentic and autonomous does not mean asking a chatbot how accurate your data is. For data coverage, accuracy and evaluation teams at data businesses, it means climbing from agents that assist, to agents that run the routine measurement under your governance, to an evaluation function that largely runs itself: computing fill rate, match rate, freshness and accuracy against truth sets, running prospect bake-offs in hours, and catching regressions before a customer does, while people own every number that leaves the building. This is what that climb looks like, step by step.
Key takeaways
- •Who this is for. The team at a data business that measures the product it sells: fill rates, accuracy against truth sets, freshness, match rates, the benchmark reports prospects ask for, and the quality numbers that go into sales decks and contracts.
- •The problem today. A bake-off on a prospect's sample file takes days of an analyst's time, truth sets go stale without anyone noticing, the numbers in the deck drift from what the product delivers, and the first sign of a regression after a release is a customer's support ticket.
- •What changes. A prospect's sample is profiled, run through the same path your customers get, and measured against your governed definitions in hours. The scorecard is recomputed on every release and every delivery, and any number you have published is re-measured on a schedule.
- •What stays with your people. Every number that goes to a customer or a prospect has a named owner. Agents compute it and attach the evidence; the owner decides what is published, and people label and sign off the truth sets.
- •The result. An evaluation team that spends its week improving coverage and accuracy instead of rebuilding the same spreadsheet for each prospect, and a product whose quoted quality is the quality it delivers.
The PRD for agentic data coverage, accuracy and evaluation teams
This is the requirements document we would write with you for your team. Everything below expands on it.
| Who | Data quality, data coverage, data accuracy, evaluation and benchmarking, sales engineering support and data product teams at data providers, alternative data vendors, market data firms, location data companies and data marketplaces |
| The job | Know, on any day, how good the product is and be able to prove it to a prospect by Friday. |
| Environment | Snowflake or Databricks; dbt; Airflow or Dagster; Great Expectations, Soda or dbt tests; truth sets and labelled samples held as tables or files; the entity resolution layer; the delivery layer your customers buy through; the decks, data sheets and contracts that quote quality numbers. |
| Constraints | Any number published to a customer or a prospect has a named owner who approves it. Truth sets are labelled and signed off by people. Prospect sample files are the prospect's data and stay inside your environment under the access you set. |
| Success is measured by | Prospect bake-off: from about three days to ~2 h; release regression check: from about a day to ~30 min; fill-rate drop traced to its source: from about a day to ~15 min; catalog and docs upkeep closed autonomously, targeting 88% as the deployment matures. |
| Owned by | A Head of Data Quality or Evaluation, with the data product owner and the head of sales engineering as named approvers. |
| Pilot scope | Bake-off preparation on your next two prospect samples, plus a regression check on one product's next release, at L2. |
What going fully agentic and autonomous means for data coverage, accuracy and evaluation teams
- •Put your data pipeline on autopilot. The scorecard is recomputed on every release and every supplier delivery, so a fill rate that slips on Tuesday is a flag on Tuesday, not a line in a customer's complaint on Friday.
- •Run the data back office without the busywork. The work that fills the week today moves to agents: profiling a prospect's file, building the comparison, recomputing the same six metrics in a new notebook, checking the deck against the product and chasing a dropped field to its source.
- •Scale data without scaling headcount. Ten products or fifty, each gets the same measurement against the same governed definitions, so the number of products you can stand behind grows without the team having to.
- •Get the plumbing off your plate. An evaluation team that decides what good looks like and which gaps to close, rather than re-deriving how a number was calculated every time someone asks.
Who this is for
The team that holds the data business to account for its own claims. At a B2B data provider, it measures how many companies and contacts the product covers, how complete each field is and how often it is right. At an alternative data vendor, it benchmarks panels and signals against reference series and reports coverage and stability to investors who run their own tests. At a market data firm, it checks completeness and timeliness of prices and reference data against exchanges and regulators. At a location data company or a marketplace, it measures place coverage, positional accuracy and the freshness of each partner's data.
The titles: Head of Data Quality, Director of Data Evaluation, Data Accuracy Lead, Benchmarking Manager, Data Product Quality Manager, the evaluation analysts and data scientists who report to them, and the sales engineers who depend on them. These leaders are measured on the commercial metrics of the product the company sells: coverage, accuracy, freshness, match rate, delivery and sell-through. This team owns the scorecard. It sits beside the teams that move the numbers: data acquisition and sourcing raises coverage, entity resolution and unified profiles sets match rate, company and person data owns the two biggest record types, and data delivery and feeds decides what a customer actually receives. The buy side has its own view of the same questions in market and reference data, and the work overlaps with geospatial and marketplace data and people and labor-market data. All of them are gathered on the data businesses page.
The product you ship
- •The scorecard: coverage, accuracy, freshness, match rate and delivery for each product, by segment, region and field, computed from the same governed definitions every time.
- •Truth sets: the labelled samples and reference series that accuracy is measured against, with owners, dates and a record of when each was last checked.
- •Bake-off reports: the benchmark a prospect asks for on their own sample file, with the method, the results and the caveats written down.
- •Release checks: the comparison of each candidate release against the last one, on coverage, fill rate and accuracy, before it reaches customers.
- •Quality numbers in sales material: the figures in decks, data sheets, security questionnaires and contracts, each tied to a definition and a measurement.
- •Customer-facing quality commitments: the freshness, completeness and accuracy terms in an SLA, and the evidence that you met them.
Where the week goes
- •Every bake-off is a custom project. A prospect sends a sample in its own format. Someone profiles it, runs it through the product, builds the comparison in a spreadsheet and writes the caveats. It takes days, and the next prospect starts from scratch.
- •Truth sets go stale. The labelled sample was right when it was built. Companies moved, people changed jobs, places closed. Accuracy measured against an old truth set flatters or punishes the product by an amount nobody knows.
- •Definitions drift. Fill rate counts blanks in one report and invalid values in another. Match rate is measured per record in the deck and per entity in the contract. Two analysts get two answers.
- •Deck numbers stop matching the product. A figure was true at the time and was pasted into a deck, a data sheet and a security questionnaire. Nobody owns re-measuring it.
- •Regressions surface in the field. A release changes a mapping, a field's fill rate drops in one region, and the first report is a customer who noticed.
- •Sample files are not production data. A prospect's file is skewed to their segment, has duplicates and invalid values of its own, and an unqualified comparison blames the product for the file.
- •Freshness is a promise. The deck says weekly. The product says weekly most weeks.
Add it up and upkeep is most of the team's week. Here is how a typical week splits today, and once agents own the back office:
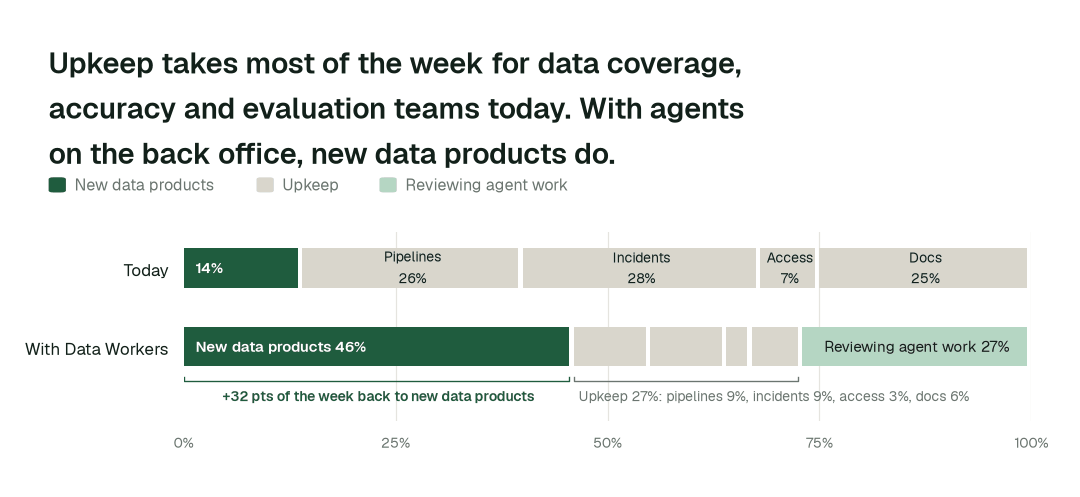
Time spent on new data products, which for this team means new evaluations, new truth sets and closing coverage gaps, moves from 14% of the week to 46%. Most of the rest becomes review: people steer and approve agent work instead of doing it by hand.
Then and now
| Work | Today | With Data Workers |
|---|---|---|
| Prospect bake-off | Days per sample, rebuilt each time | Profiled, run through the production path and measured in hours |
| Metric definitions | One per analyst | One governed definition per metric, used everywhere |
| Truth sets | Checked when someone remembers | Disagreements with fresher evidence flagged for review |
| Release regressions | Found by customers | Caught on the candidate release, with affected customers listed |
| Numbers in decks and contracts | Pasted once, never re-measured | Re-measured on a schedule, differences sent to the owner |
| Coverage and fill-rate drops | A day of tracing | Traced to the source, delivery or release that caused them |
These are the impact metrics we move for data coverage, accuracy and evaluation teams:
- •Prospect bake-off: from about three days to ~2 h
- •Release regression check: from about a day to ~30 min
- •Fill-rate drop traced to its source: from about a day to ~15 min
Across the routine work in this domain:
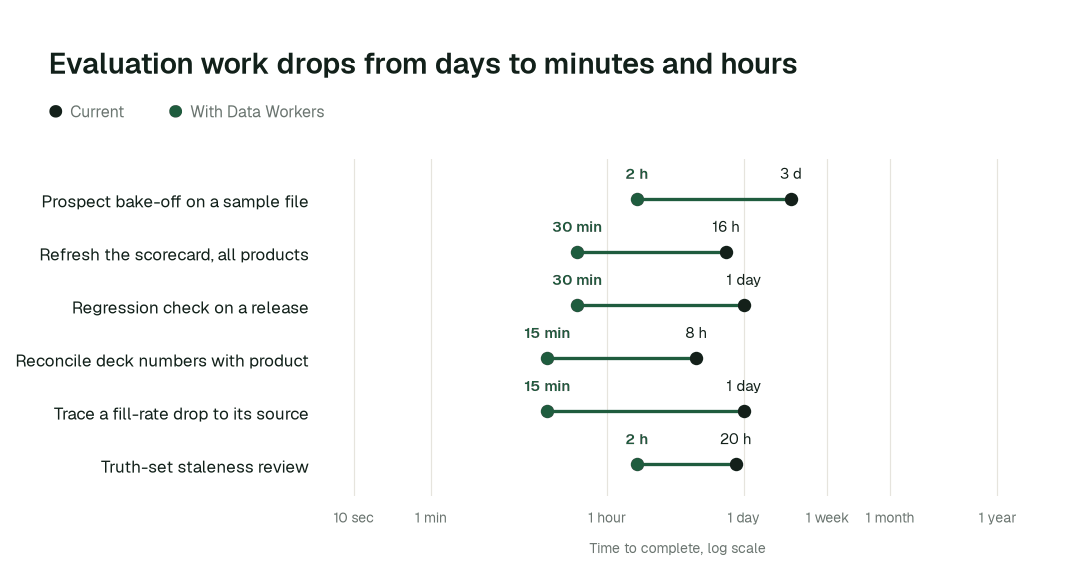
The biggest change is the prospect bake-off: from about three days to ~2 h. Work that waited in queues finishes in minutes or hours, because agents detect, measure and verify in one pass.
Use cases, in depth
A bake-off on a prospect's sample file
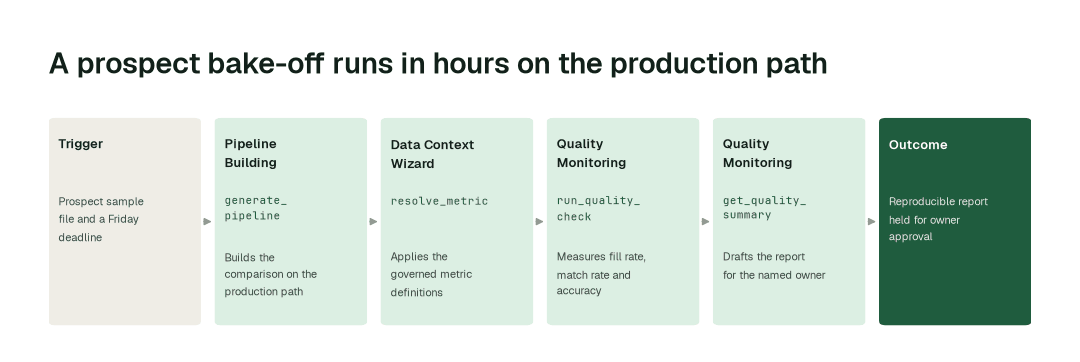
Today. A sales engineer forwards a sample file with a deadline. An analyst profiles it by hand, runs it through the product in a one-off notebook, calculates fill rate and match rate with whatever definition they remember, compares with the truth set, and writes the caveats from memory. The numbers go out two or three days later, and nobody can quite reproduce them.
With Data Workers. The Data Ingestion agent lands and profiles the file, including its own duplicates and invalid values. Pipeline Building builds the comparison so the sample runs through the same path your customers' data takes. Data Context Wizard supplies the governed definition of each metric, and Quality Monitoring computes fill rate per field, match rate and agreement with the truth set, and separates problems in the file from gaps in the product. The report arrives with its method, its numbers and its caveats for the named owner.
What changes. The prospect gets a benchmark that is fast, fair to both sides and reproducible, and the analyst reviews it instead of building it.
A release that quietly lowers a fill rate
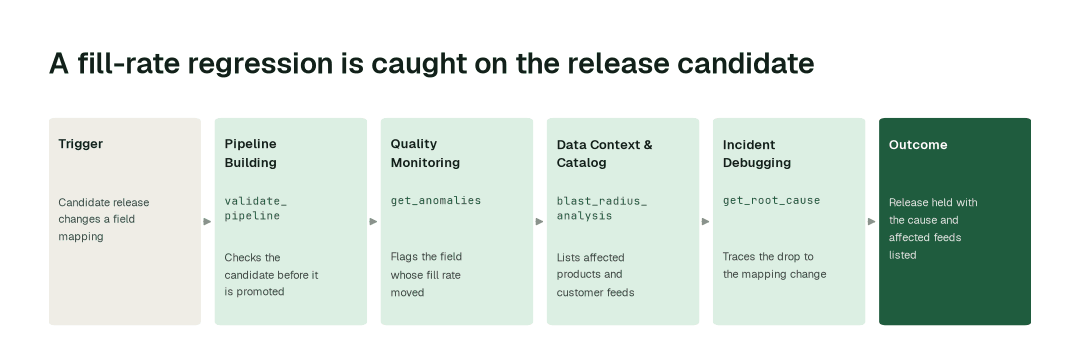
Today. A mapping change ships on Wednesday. Fill rate on one field drops in two regions. The dashboards that exist watch pipeline health, which is green. A customer reports empty fields the following week, and the team spends a day finding which release did it.
With Data Workers. Quality Monitoring compares the candidate release with the last one on the checks the team has defined for coverage, fill rate and accuracy, and flags the field that moved. Data Context & Catalog follows lineage to the products and customer feeds that carry it. Incident Debugging traces the drop to the mapping change. Conductor holds the release for the product owner with the evidence and the options.
What changes. The customer never sees the regression, and the team learns about it on the candidate, not in the field.
Deck numbers that match the product
Today. The sales deck says 94% of companies have an industry code, the data sheet says 92% and the last security questionnaire says "over 90%". All three were true once. The product has since changed, and so has the definition of "has an industry code".
With Data Workers. The team lists the quality numbers it has published, and the Data Context & Catalog agent ties each to one governed definition. On a schedule and after each release, Quality Monitoring re-measures them against the production product. When a measured value moves outside the tolerance the owner has set, Conductor sends the owner one decision: update the material, or investigate the product.
What changes. The quality in the deck is the quality in the product, and a change is a decision someone made, not drift nobody noticed.
Measure the product, not just the pipeline
Evaluation teams are judged on whether the numbers are right, not on how many checks ran. Data observability tells you the pipeline is healthy. It does not tell you that the product's coverage of small companies in one country slipped three points. The Autopilot dashboard shows how much of each measurement runs on its own and at what token cost, and alongside it the team tracks what the business sells:
- •Coverage: entities, fields, regions and segments covered, against the universe you claim.
- •Accuracy: agreement with the truth set, by field and segment, with the date the truth set was last checked.
- •Freshness: time from the real-world change, or from the supplier's delivery, to the live product, against what you promise (how freshness SLAs are monitored).
- •Match rate: the share of records that resolve to an entity, which is where entity resolution picks up.
- •Fill rate: the share of records with a valid value in each field.
- •Delivery and sell-through: whether what was measured is what each customer feed contains, which is where data delivery picks up, and which products' quality is moving revenue.
Agents working together: a bake-off due on Friday
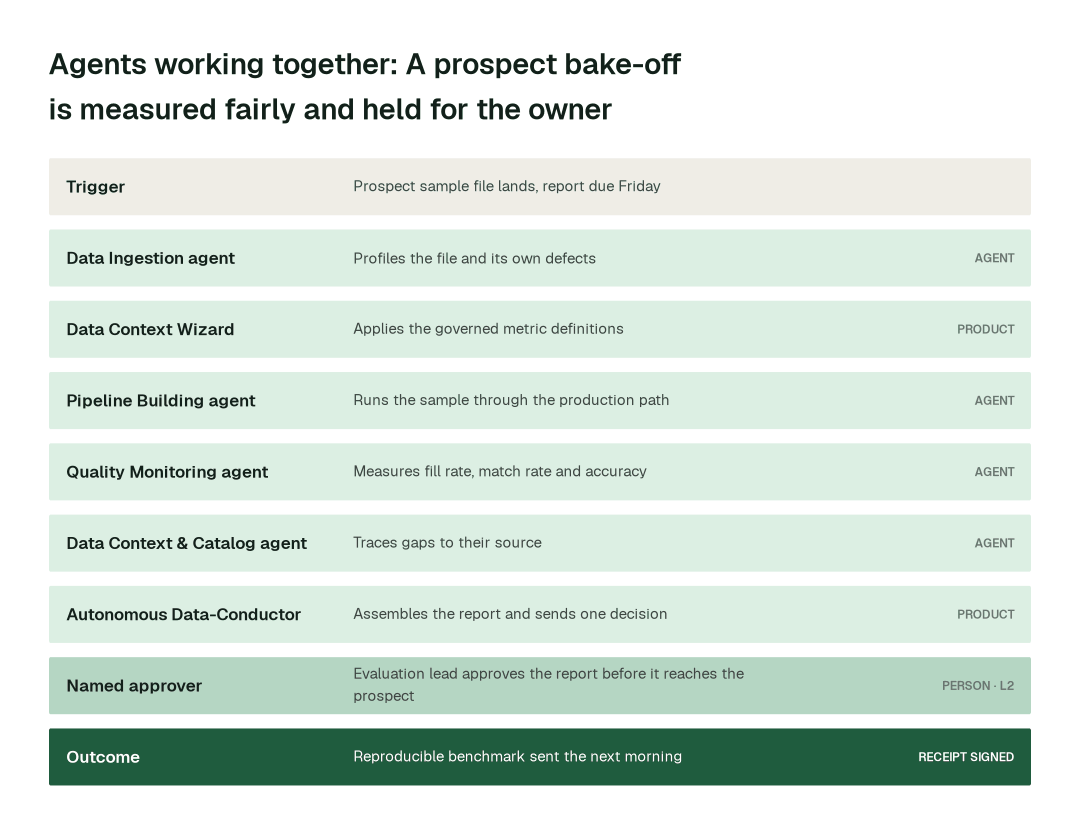
Every evaluation team knows this request. On Wednesday afternoon a sales engineer forwards a prospect's sample file, a list of six fields to benchmark and a Friday deadline. The prospect will also compare two other vendors on the same file. The team's usual process is three days of an analyst's time. This is the same request run by Data Workers.
The setup
The product is a company database delivered by data share and file feed. The truth set is a labelled sample of 600 companies the team checked this quarter. The prospect has also labelled 400 records of its own. Autonomy in Autopilot:
- •Profiling, scorecard refresh, release checks and catalog upkeep: L2 today; a candidate for L3 on evidence.
- •Draft bake-off reports and deck reconciliation: L2, held for the evaluation lead.
- •Numbers sent to a prospect or put in a contract, and truth-set labels: L2 at most, held for a named owner.
The team scheduled one mission earlier: "For every prospect sample, run the production path and report against the governed definitions."
Wednesday 14:00: the file arrives
The sales engineer drops the file into the prospect-samples area of the data environment. The prospect's data stays in your infrastructure.
14:05: profile it
Data Ingestion agent lands the file and profiles it: 40,212 rows, 1,106 duplicate rows, three of the six fields mostly empty in the prospect's own data, and postcodes in four different formats.
14:20: agree on the definitions
Data Context Wizard supplies the governed definition of fill rate, match rate and accuracy that the team publishes elsewhere, so the bake-off does not invent a new one. The report will say which definition each number uses.
14:35: run it through the real path
Pipeline Building agent builds the comparison so the sample runs through the same matching and enrichment path your customers' data takes, rather than a one-off notebook, and validates it before the run.
15:10: measure
Quality Monitoring agent computes fill rate for each of the six fields, match rate for the file, and agreement with both the team's truth set and the prospect's own 400 labelled records. It separates the 1,106 duplicates and the invalid postcodes, so problems in the file are not charged to the product, and the report shows the results with and without them.
15:40: explain the gaps
Match rate is lower in one country. Data Context & Catalog agent follows lineage from that country's records to the supplier that feeds them and shows the coverage gap there, with the date the supplier last delivered. Incident Debugging agent confirms the gap is upstream and not a bug in the matching path.
16:00: compare with what you have said
Quality Monitoring agent compares the results with the figures in the current deck. Two differ: the industry code fill rate on this file is below the deck's figure, because 61% of the prospect's file is micro-businesses, a segment where the product is thinner. The report notes the segment, rather than quietly applying the deck's figure.
16:20: one decision
Autonomous Data-Conductor assembles the report: method, definitions, results, caveats, the two differences from the deck and a list of what could not be measured. It sends the evaluation lead one decision: approve the report for the sales engineer, or change it.
Thursday 09:00: approved
The evaluation lead approves, rewrites one caveat in her own words and asks for the segment table to be added. Conductor applies the change and publishes the report to the sales engineer. The same file's results are filed against the prospect's record.
What stays behind
- •The bake-off report, with the definitions, the method and the query behind each number, so anyone can reproduce it.
- •A note on the micro-business segment and the country gap, where the product genuinely is thinner, handed to the teams that can close them.
- •A receipt for every step: who proposed it, who approved it and how to roll it back.
- •A reusable mission. The next prospect's sample runs the same way.
Minute by minute
This is an illustrative example. The product is built in Snowflake with dbt under Airflow and delivered by data share and file feed. Numbers sent to a prospect are held at L2 for the evaluation lead.
| Time | Who | What happens |
|---|---|---|
| Wed 14:00 | Sales engineer | Prospect sample and field list dropped into the environment |
| 14:05 | Data Ingestion agent | File profiled: 1,106 duplicate rows, mixed postcode formats |
| 14:20 | Data Context Wizard | resolve_metric: governed fill rate, match rate and accuracy definitions |
| 14:35 | Pipeline Building agent | validate_pipeline: comparison runs the production path |
| 15:10 | Quality Monitoring agent | run_quality_check: fill rate, match rate, accuracy, with and without file defects |
| 15:40 | Data Context & Catalog agent | trace_cross_platform_lineage: one country's gap traced to a supplier |
| 16:00 | Quality Monitoring agent | get_quality_summary: two differences from the deck flagged |
| 16:20 | Spellbook Data Catalog | Report held at L2 with the evidence |
| Thu 09:00 | Spellbook Data Catalog | Evaluation lead approves, edits one caveat, sends |
The agents on the job
| Agent | What it does on an evaluation team | Tools it calls |
|---|---|---|
| Connectors and Data Ingestion | Land prospect samples, truth sets and supplier files, profile every load and keep the existing test suites running | get_connector_status, get_dbt_test_results, run_gx_suite, run_soda_suite |
| Pipeline Building | Build and validate the measurement and comparison pipelines as reviewed changes | generate_pipeline, validate_pipeline, deploy_pipeline |
| Quality Monitoring | Compute fill rate, accuracy and freshness, compare releases, watch for drift and keep the SLA | set_sla, run_quality_check, get_anomalies, get_quality_score, get_quality_summary, create_quality_tests_for_pipeline |
| Schema Evolution | Detect field and layout changes that move a metric and show what they touch | detect_schema_change, assess_impact |
| Incident Debugging | Trace a coverage or fill-rate drop to the release, supplier or mapping that caused it | diagnose_incident, get_root_cause |
| Data Context & Catalog | Keep each metric, truth set and product documented, with lineage and an authoritative source | resolve_metric, define_business_rule, check_freshness, check_staleness, flag_stale_context, trace_cross_platform_lineage, blast_radius_analysis, generate_documentation |
| Data Access & Governance | Keep prospect samples and truth sets inside the access you set and log every use | check_policy, scan_pii, generate_audit_report |
Data Context Wizard holds one governed definition of every metric your company sells, so the scorecard, the bake-off, the data sheet and the contract all quote the same number the same way. Autonomous Data-Conductor verifies the outcomes that matter before a report goes to its owner and before a release is promoted. Spellbook Data Catalog gives each product, truth set and metric a page in plain English: what it measures, how it is defined, when it was last checked and who owns it.
What goes on autopilot
Once a product has earned it, this work runs on its own, and each item removes a problem your team deals with today:
- •The scorecard is recomputed on every release and every delivery, so a slipping fill rate or coverage gap is a flag the same day.
- •Release candidates are compared with the last release before they ship, so the first report of a regression is yours.
- •Drafts of bake-off reports are built from the prospect's sample, so the analyst reviews a finished comparison instead of assembling one.
- •Truth-set records that disagree with fresher evidence are flagged, so you know when a reference has aged before it skews a result.
- •Metric pages, definitions and lineage are kept current, so "how is this number calculated" always has an answer on the page.
Where your people stay in charge
Agents never get blanket access. Each product has its own autonomy level, set by you, and it only rises when the receipts show the agents are reliable. Everything starts at L1, observing only; reversible upkeep such as recomputing the scorecard, reruns, documentation and monitoring is usually first to run on its own.
- •Any number published to a customer or a prospect has a named owner and goes to that owner. Agents compute it and attach the evidence; the owner decides what is said. That covers bake-off reports, deck and data sheet figures, questionnaires and contract terms.
- •Truth sets are labelled, relabelled and signed off by people. Agents flag records that look stale and propose where to look; they do not change the reference they are measured against.
- •Metric definitions change only through a named approver. What counts as a filled field or a match is a commercial decision.
- •Release holds and quality commitments in a contract go to the data product owner.
Once a deployment has matured, here is how that ladder plays out across task classes:
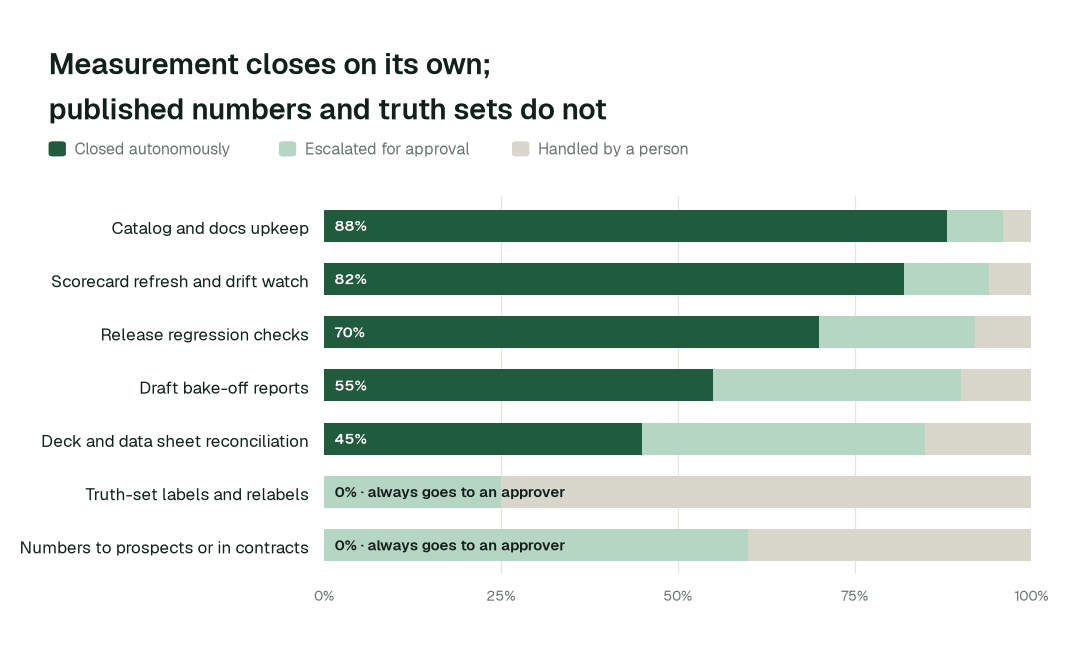
Catalog and docs upkeep closes autonomously 88% of the time. For numbers published to a prospect or in a contract, autonomous closure is 0% by design: agents compute and evidence, and a named owner decides.
What happens when an agent is wrong
- •At L2 propose, nothing leaves the building until a named person approves. The proposal shows the number, the definition, the input and the query that produced it, so the owner can re-run it. Unanswered requests expire and escalate.
- •L3 and L4 are where a domain can go next, on its own review record: acting on its own, with a rollback point on every change. Only the domain's owner raises its level, and if people start reverting the agents' changes, the domain pauses itself.
- •No agent approves or promotes its own work. An agent that computed a number does not also approve it. Autonomy only grows on evidence, domain by domain, and repeated reverts pause the domain.
- •A published number that turns out to be wrong is traceable to the definition, the sample and the run that produced it, and the report that carried it can be listed, so the correction goes to every recipient, not just the one who noticed.
- •One org-wide stop halts all autonomous dispatch, and every action lands in a tamper-evident audit trail you can export with
generate_audit_report.
How it fits your stack
Data Workers connects to what you already run: Snowflake or Databricks; dbt; Airflow or Dagster; the tests you already have in Great Expectations, Soda or dbt; your truth sets and labelled samples; the entity resolution layer; and the delivery layer your customers buy through. Each agent is an MCP server, so the same agents work inside Claude Code, Cursor or Codex and in Slack or Teams through Spellbook. Over 50 connectors are available. Nothing migrates.
- •Keeps your tests. Agents run the suites you already trust (
run_gx_suite,run_soda_suite,get_dbt_test_results) and add checks for what they do not cover, rather than replacing them. - •Runs in your infrastructure with your credentials and your model key. The hosted Autonomous Data-Conductor sees workflow metadata only, never rows. That matters when the rows are a prospect's sample file or a licensed supplier's data.
- •Uses the access you already govern. Agents act under scoped service identities and your existing roles; access to prospect files and truth sets goes through
check_policyand is logged. - •Fits a data contract. Freshness, completeness and accuracy commitments can be written down in an open format such as the Open Data Contract Standard, and agents check each delivery against them. See how agents enforce data contracts and data quality SLA examples.
- •Proposes changes as diffs in your dbt project, orchestrator and warehouse, with blast radius, tests and a rollback point, and applies them only at the autonomy level you set for that product.
- •Open-source core. The Apache-2.0 community edition ships 11 agents and 160+ MCP tools, so your engineers can read exactly what the agents call.
To see what the quality agent does day to day, read Inside the Quality Monitoring Agent. The method behind its improvement cycle is described in what Deming's Plan-Do-Study-Act taught the data quality agent.
Governance and regulation
A data business that quotes a quality number is making a representation to a buyer, and that number often ends up in a contract or a procurement questionnaire. When a customer disputes it, the answer has to come from the measurement, not from the memory of whoever wrote the deck. Data Workers keeps each published number tied to its definition, its sample and its run, and records who approved it.
For person data, accuracy is also a legal principle. The GDPR requires personal data to be accurate and, where necessary, kept up to date (Article 5(1)(d)), so measuring and improving accuracy on person records is part of running the product lawfully, not only commercially. Prospect samples may contain personal data too. Data Workers flags it with scan_pii, keeps it inside the access rules you set and logs every use. How long a prospect's file is kept is a decision for you and the prospect's agreement.
Data Workers doesn't make you compliant; your controls, people and assessors do. It supplies controls and evidence wherever agents touch data. Not legal advice.
The alternatives data coverage, accuracy and evaluation teams weigh
Build it yourselves. A strong team can wire a coding agent to MCP servers for the warehouse and dbt and produce a bake-off notebook in an afternoon. The work is everything around it: one governed definition per metric, routing each number to its owner, blast radius, rollback, receipts, and a record of every number that was ever sent out.
Data observability platforms. Observability tools watch pipelines and tables for anomalies, and they do that well. They are not built around your truth sets, your commercial metrics or your prospects' files. Data Workers takes their signals, measures what the business sells, diagnoses the cause, proposes the fix and leaves the receipt. See how Data Workers differs from data observability.
Test frameworks and notebooks. dbt tests, Great Expectations, Soda and analysts' notebooks are the right way to express a check. Agents run them and keep them current; they do not replace them.
Platform-native agents. Warehouse vendors' agents work well inside their platform. Evaluation crosses the prospect's file, the truth sets, the warehouse, the orchestrator and the delivery layer, and Data Workers works across all of them.
In this space specifically. Commercial data-quality and master-data suites score the data you hold. Data Workers does that and also does the bake-off: it takes a stranger's file, measures it fairly and puts the result in front of the person who has to sign it.
The case for your CTO
What this replaces. Days per bake-off, definitions that differ between reports, truth sets that age unseen, deck figures nobody re-measures and regressions that customers find first.
What your team gets back. An evaluation team that improves coverage and accuracy instead of rebuilding comparisons, and a sales organisation that can answer a prospect's data request in hours with numbers the company will stand behind.
Integration effort. Connecting is configuration, not a migration. The agents attach over MCP to the warehouse, orchestrator, dbt project, test suites and truth sets you already run, under the roles you already govern, inside your own infrastructure. Your engineers can read every tool the agents call in the open-source core.
Risk and control. Autonomy is set per product. Everything starts at L1, observing only; reversible work moves up only when the receipts justify it; published numbers, truth-set labels and metric definitions stay with a named approver; and one org-wide stop halts all autonomous work.
Why now. Buyers run their own bake-offs against two or three vendors at once, and AI agents now consume data feeds directly, so a quality gap is found faster and by more people. The vendor that answers with a reproducible benchmark in hours is the one that stays in the evaluation.
The first win. Bake-off preparation on your next two prospect samples and a regression check on one product's next release, at L2. The pilot below lays out the scope, what you see each week and the cost.
The climb: from assisted to autonomous to agentic
Our thesis is that the data platform climbs the way analytics did, in stages, and that the hard part of data work was never knowing what to do but doing it. For data coverage, accuracy and evaluation teams, the climb looks like this:
- •Assisted. Agents work alongside your team. They read your products and truth sets, show where the scorecard is thin and propose every report with its evidence; every published number goes to a named owner.
- •Autonomous, under your governance. Routine work runs on its own: the scorecard is recomputed on every release, release candidates are compared with the last release, prospect samples are measured against governed definitions, and metric pages stay current. Your team governs the agents instead of doing the upkeep.
- •The agentic data business. An evaluation function that decides what good looks like and which gap to close next, while the quality numbers in every deck, contract and feed track what the product delivers. People set direction, and the platform carries it out.
You choose the altitude, every step is visible and reversible, and the pilot below is the first rung.
The pilot: how data coverage, accuracy and evaluation teams start
The pilot is how your team proves the value on its own data before committing.
- •What we connect. Snowflake or Databricks, dbt, Airflow or Dagster, your existing test suites, your truth sets and the delivery layer, over MCP, inside your infrastructure. Nothing migrates.
- •Scope. Bake-off preparation on your next two prospect samples, plus a regression check on one product's next release, at L2.
- •First week. Agents run at L1 across the scoped product. They map lineage, document the metrics you already quote, recompute them against your governed definitions and show where today's published figures differ from the product, with receipts, so your team sees the value before anything changes.
- •By week two. Scorecard refresh and documentation upkeep start running on reversible work. Bake-off reports, deck figures and anything that leaves the building stay at L2 with a named owner.
- •At day 30. We review the impact metrics against your baseline:
- •Prospect bake-off: from about three days to ~2 h
- •Release regression check: from about a day to ~30 min
- •Fill-rate drop traced to its source: from about a day to ~15 min
- •the share of catalog and docs upkeep closed autonomously, targeting 88% as the deployment matures
- •What you decide. Whether to expand to the next product. The pilot fee is credited in full against the first year.
- •Cost. Start with a pilot ($7,500 one-time, a 6 to 12 week pilot, credited in full against the first year). Scale is from $1,000 a month and Enterprise from $3,000 a month, billed annually, with unlimited seats, no usage meter and no markup on model spend. See pricing.
The pilot is the start of a longer curve:
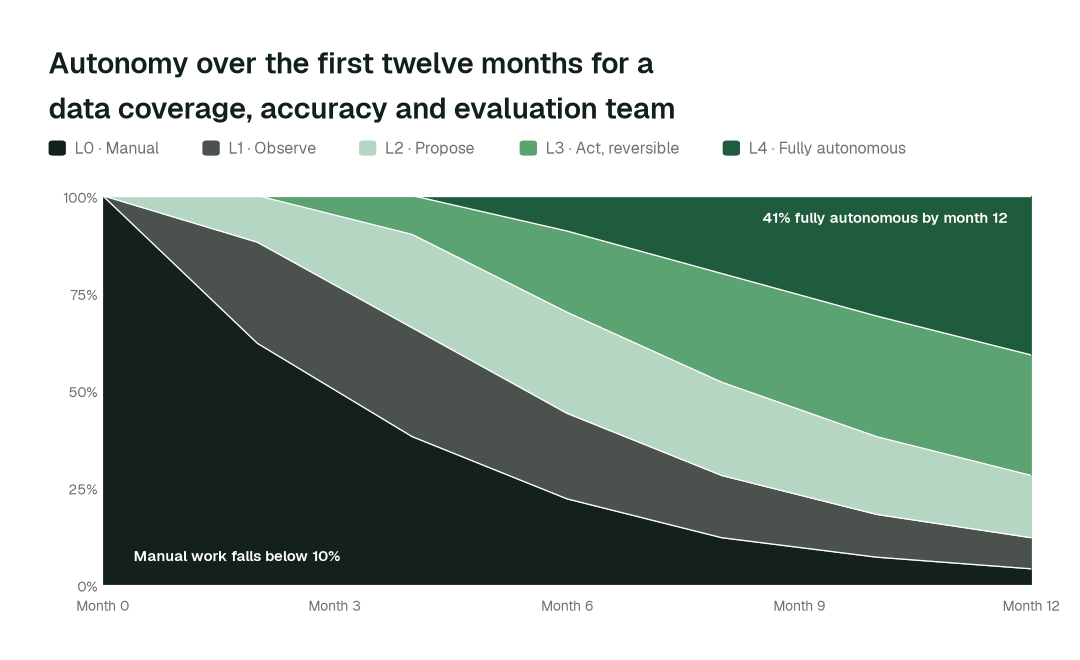
By month 12, more than 40% of agent actions run fully autonomously and manual work falls below 10%, while published numbers and truth-set labels stay with a named owner.
FAQ
Can it run a bake-off on a prospect's file in a format we have never seen? Agents land delivered files and API feeds from SFTP, S3 and HTTP sources and profile them on arrival. The report says what could not be read.
Will agents publish numbers to prospects on their own? No. They compute and evidence; the named owner approves what is sent.
Who decides the definition of fill rate or match rate? You do. The definition is recorded once in Data Context Wizard, changed only through a named approver and quoted the same way in every report.
Can it keep our truth sets current? It flags truth-set records that disagree with fresher evidence and tells you where to look. People relabel and sign off.
Does it replace our dbt tests or Great Expectations suites? No. It runs them, reads the results and adds checks where nothing exists.
Where do the agents run? In your infrastructure, with your credentials and model key. The hosted Conductor sees workflow metadata only, so a prospect's file does not leave your environment.
Do we have to migrate anything? No. Your warehouse, dbt project, orchestrator, catalog and delivery layer stay where they are.
Sources
- •Data Workers pricing: https://dataworkers.io/pricing/
- •European Union, General Data Protection Regulation (Regulation (EU) 2016/679), including Article 5(1)(d) on accuracy: https://eur-lex.europa.eu/eli/reg/2016/679/oj
- •Bitol, Open Data Contract Standard: https://bitol-io.github.io/open-data-contract-standard/