Value creation tracking data, run by agents
Value creation plans live in decks while the operating data that proves them lives in each company's systems. Here is how Data Workers runs it instead.
Key takeaways
- •The problem today. Value creation plans live in decks while the operating data that proves them lives in each company's systems.
- •What changes. Agents link initiative metrics to operating data and keep progress current without asking companies for spreadsheets.
- •What stays with your people. Figures reported to the board: they drive decisions.
- •The result. Value creation is tracked on live operating data.
The problem today
Value creation plans live in decks while the operating data that proves them lives in each company's systems.
What changes with Data Workers
Agents link initiative metrics to operating data and keep progress current without asking companies for spreadsheets.
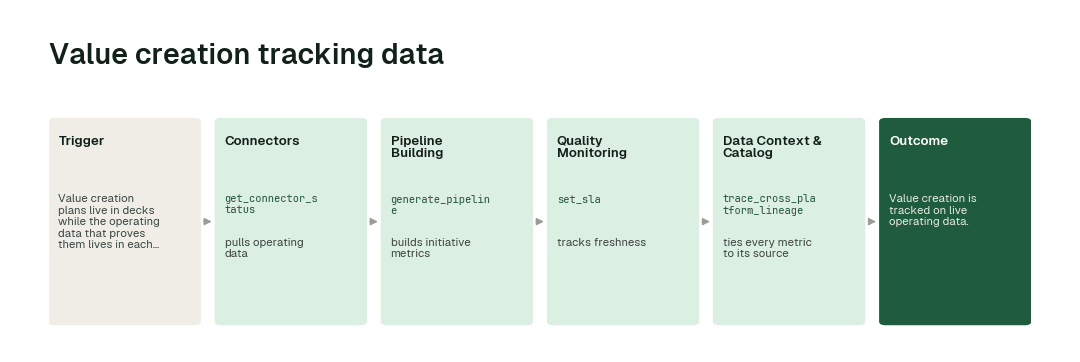
The workflow, step by step
- 1.The Connectors agent calls
get_connector_statusand pulls operating data. - 2.The Pipeline Building agent calls
generate_pipelineand builds initiative metrics. - 3.The Quality Monitoring agent calls
set_slaand tracks freshness. - 4.The Data Context & Catalog agent calls
trace_cross_platform_lineageand ties every metric to its source.
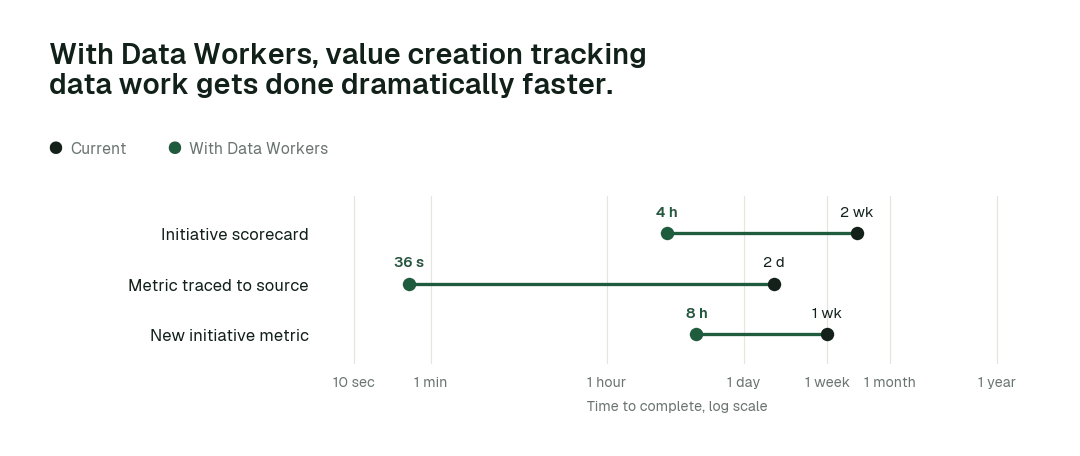
The impact metrics we move
- •Initiative scorecard: from about 2 weeks to 4 h
- •Metric traced to source: from about 2 days to seconds
- •New initiative metric: from about a week to 8 h
What goes on autopilot
- •Initiative metrics update from operating data, so no spreadsheet requests.
- •Every metric traces to its source, so the board trusts it.
Where your people stay in charge
Figures reported to the board always go to a named approver, because they drive decisions. Everything starts at L1, observing only, and autonomy rises only on evidence.
The pilot
- •Scope. Two initiatives at one company.
- •First week. Agents run at L1, observing only, and show the fixes they would have made, with receipts.
- •By week two. The routine work above runs on its own; anything sensitive stays with a named approver.
- •At day 30. We review the impact metrics against your baseline:
- •Initiative scorecard: from about 2 weeks to 4 h
- •Metric traced to source: from about 2 days to seconds
- •New initiative metric: from about a week to 8 h
- •Cost. Start with a pilot ($7,500 one-time, credited in full against the first year). Scale is from $1,000 a month and Enterprise from $3,000 a month, billed annually, with unlimited seats, no usage meter and no markup on model spend. See pricing.
Related: The private equity hub · The full team playbook