Clinical, financial and operational data that keeps up with care: the agentic data back office for health systems and providers
The agentic data back office for health systems and providers. That is the bar for health system and provider data teams once agents run the data back office, and it is reachable with the estate you already have. Here is how it works, use case by use case, and what changes compared with today.
Key takeaways
- •Who this is for. Data leaders and teams at health systems, hospitals and provider groups.
- •The problem today. Analysts reconcile instead of analyzing.
- •What changes. Data Workers keeps EHR, ADT, billing and workforce data verified and joined, classifies PHI on arrival and gives every department one governed set of definitions.
- •What stays with your people. Anything that moves money, a filing or a regulated number waits for a named approver.
- •The result. Teams spend their time on health systems and providers decisions, not on reconciling data.
The shift
Health systems run revenue cycle, quality, capacity and workforce decisions on EHR, billing and operational data that arrive at different speeds. Analysts reconcile instead of analyzing.
Data Workers keeps EHR, ADT, billing and workforce data verified and joined, classifies PHI on arrival and gives every department one governed set of definitions.
The use cases we run in health systems and providers
- •[Revenue cycle data](/use-cases/revenue-cycle-management/). Leakage is found weekly, not at month-end.
- •[Population health data](/use-cases/population-health/). Care managers work from lists that are days old, not months.
- •[Cost intelligence data](/use-cases/cost-intelligence/). Service-line margins refresh with every close.
- •[Capacity and patient flow data](/use-cases/capacity-patient-flow/). Morning huddles run on census that was verified an hour earlier.
- •[Clinical quality data](/use-cases/clinical-quality/). Quality teams see measures monthly with lineage ready.
- •[Workforce and staffing data](/use-cases/workforce-staffing/). Managers see productivity daily, not after the pay period.
- •[Value-based care data](/use-cases/value-based-care/). Contract performance is visible monthly, not at settlement.
Teams we work with in health systems and providers
Each team has a full playbook and a best-practice report.
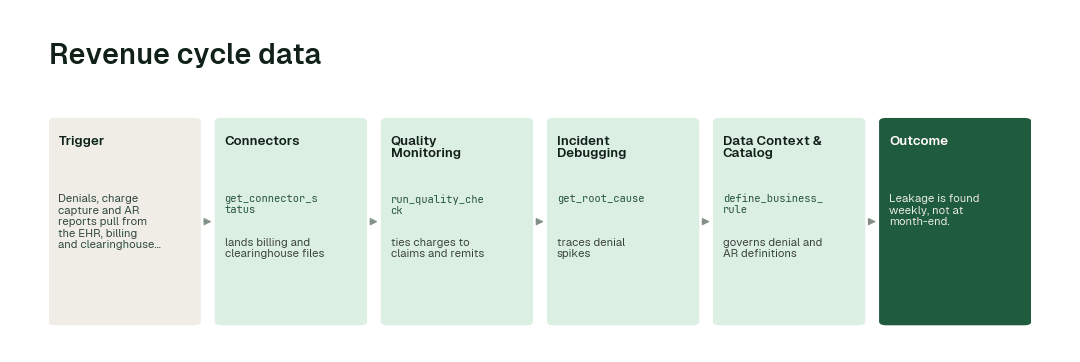
A workflow, end to end: revenue cycle data
Agents tie charges, claims, remits and denials together on every load and trace leakage to its source.
The impact metrics we move
- •Charge-to-claim tie-out: from about a week to 15-20 min (revenue cycle data)
- •Registry refresh: from about a month to 1 day (population health data)
- •Cost model refresh: from about a month to 1 day (cost intelligence data)
- •ADT feed gap caught: from about 4 hours to minutes (capacity and patient flow data)
- •Measure refresh: from about 3 months to 1 day (clinical quality data)
- •Productivity report: from about 2 weeks to 4 h (workforce and staffing data)
- •Payer file mapped: from about a week to ~1 h (value-based care data)
The climb: from assisted to autonomous to agentic
Our thesis is that the data platform climbs in stages. In health systems and providers: agents first assist, proposing every fix with a receipt; then routine verification, mapping and reconciliation run on their own under your governance; and finally the back office largely runs itself while people set direction.
The pilot
- •Scope. One use case from the list above, on one line of business.
- •First week. Agents run at L1, observing only, and show the fixes they would have made, with receipts.
- •By week two. The routine work above runs on its own; anything sensitive stays with a named approver.
- •At day 30. We review the impact metrics against your baseline:
- •Charge-to-claim tie-out: from about a week to 15-20 min
- •Registry refresh: from about a month to 1 day
- •Cost model refresh: from about a month to 1 day
- •Cost. Start with a pilot ($7,500 one-time, credited in full against the first year). Scale is from $1,000 a month and Enterprise from $3,000 a month, billed annually, with unlimited seats, no usage meter and no markup on model spend. See pricing.