Best practices for agentic viewership data: a field guide for streaming and audience data teams
Media groups run viewership across brands, apps and measurement vendors, and every org counts a view differently. This report covers how viewership teams keep one version of the truth with agents.
Viewership used to be a ratings number from a panel. Now it is first-party playback from a dozen apps, set-top box data, vendor measurement and a household identity graph, joined into audience products that ad sales sells and programming relies on.
Large media companies run this work in several orgs at once: direct-to-consumer, ad sales, programming and the studio, each with its own data product team and its own definition of a view. Every app release, vendor method change and identity update breaks something.
Agents make it possible to run one governed viewership layer across all of them, with reconciliation that happens daily rather than in quarterly reviews.
The old world
An app release changes how autoplay starts are logged. Minutes per view fall for one app, programming debates whether audiences are leaving, and the weekly viewership number goes out with a caveat. Playback and vendor numbers have not been reconciled since last quarter.
The new world
With Data Workers, Streaming detected the logging change, Quality Monitoring isolated the app, Incident Debugging confirmed it was logging rather than behavior, Pipeline Building separated autoplay starts and Conductor held the weekly report for one approval. Playback is reconciled against vendors every morning.
Here is that new world as a chain of hand-offs between agents:
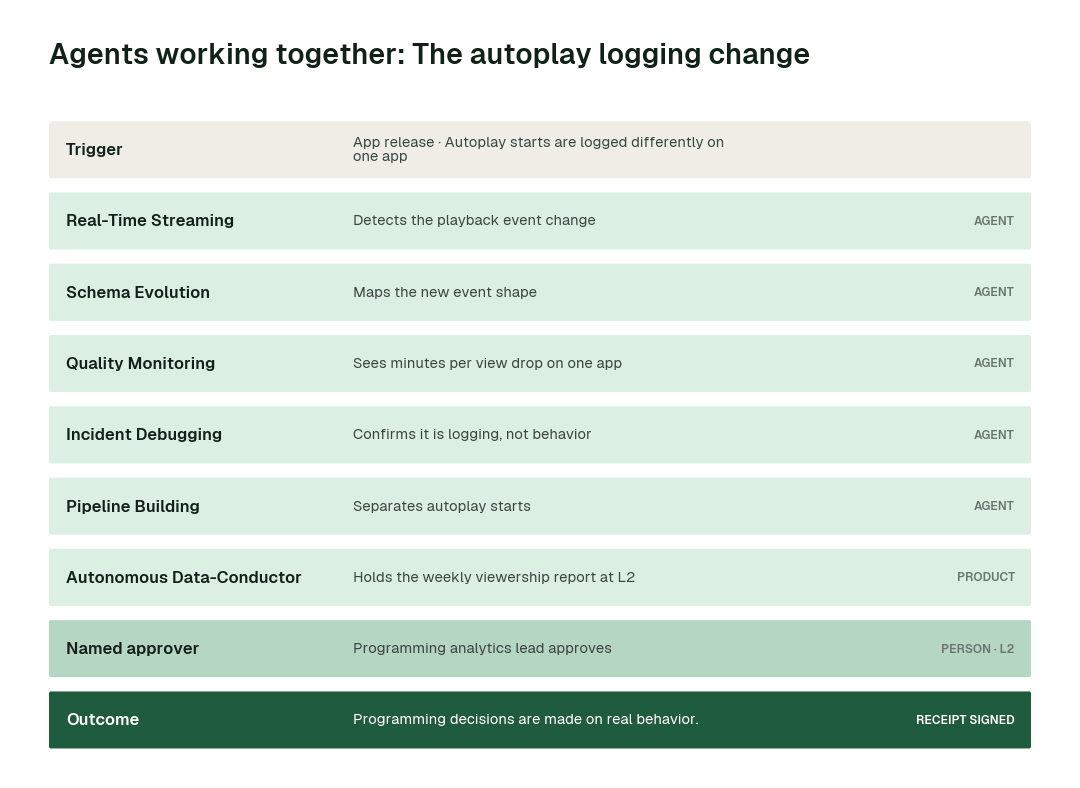
The full playbook walks through this scenario and three more use cases in depth.
The rest of this report walks through the 6 practices that make that morning possible. At a glance:
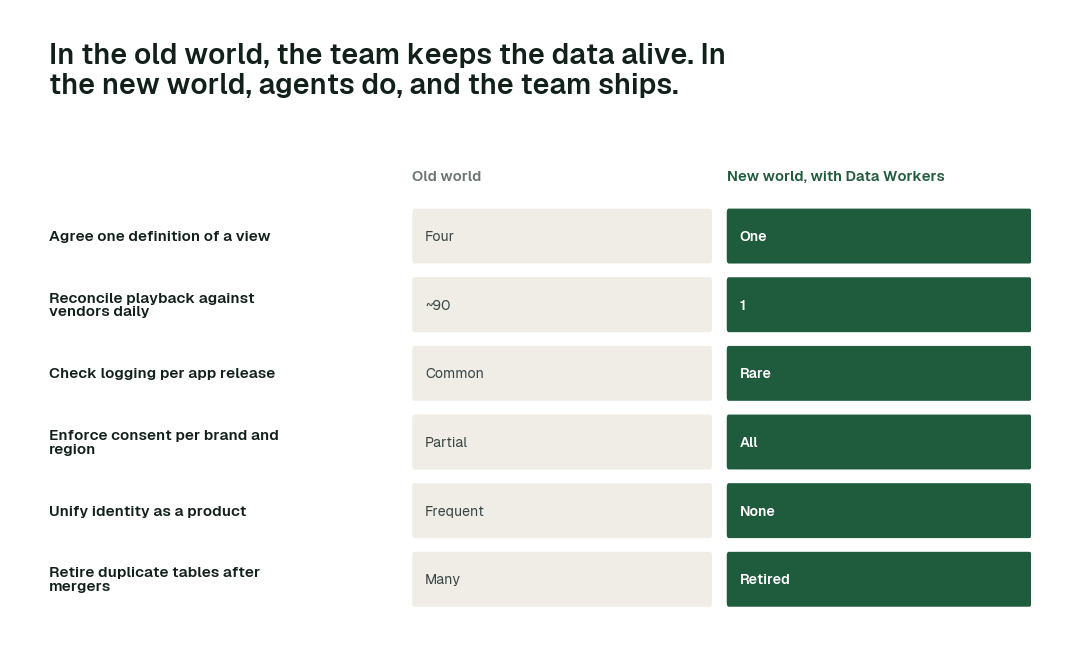
The practices, one by one
1. Agree one definition of a view
Four orgs counting views four ways is the default.
The old world. Different definitions per org.
The new world. Context Wizard holds one governed definition used by DTC, ad sales, programming and finance.
In practice. The weekly number is the same in every deck.
What to measure. Live definitions of a view.
2. Reconcile playback against vendors daily
Measurement methods change.
The old world. Quarterly reviews.
The new world. Conductor runs a daily reconciliation and escalates divergences with evidence.
In practice. A vendor method change is explained the next morning.
What to measure. Days to explain a divergence.
Practices like these compound. Across the routine work they cover, here is the difference in elapsed time:
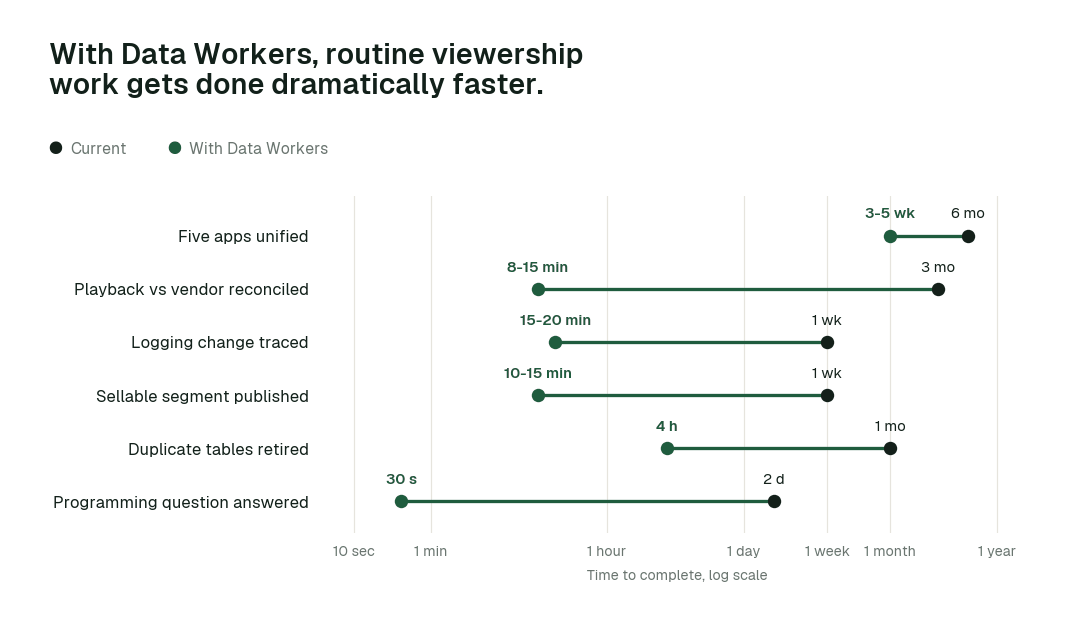
The biggest change is Playback vs vendor reconciled: from about 3 months to 8-15 min. Work that waited in queues finishes in minutes or hours, because agents detect, fix and verify in one pass.
3. Check logging per app release
App releases change event semantics.
The old world. Found in weekly reviews.
The new world. Streaming and Quality Monitoring check playback events per app version.
In practice. An autoplay change is isolated on release day.
What to measure. Logging incidents reaching programming.
4. Enforce consent per brand and region
Segments must respect every rule.
The old world. Checked by hand.
The new world. Access & Governance applies consent and brand policies to every segment.
In practice. A sellable segment respects regional consent automatically.
What to measure. Segments with consent enforced.
5. Unify identity as a product
Device graphs change and audience sizes jump.
The old world. Investigated for days.
The new world. Quality Monitoring tracks audience-size drift and Incident Debugging traces jumps.
In practice. An identity change is traced on the first jump.
What to measure. Unexplained audience-size jumps.
That balance, autonomy where work is reversible and a named approver where it matters, shows up clearly by task class:
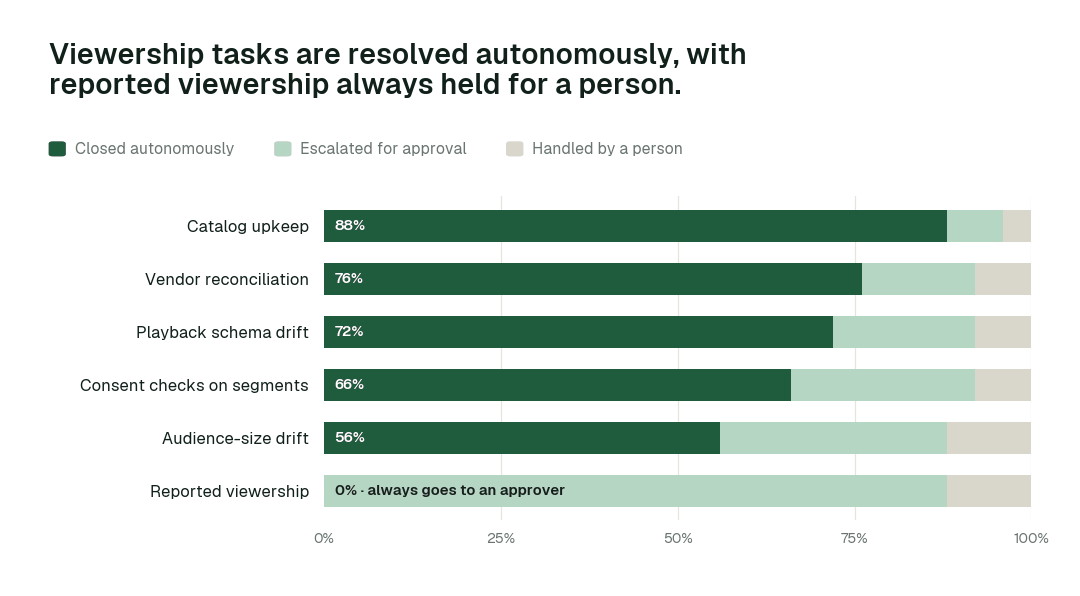
Catalog upkeep closes autonomously 88% of the time. For Reported viewership, autonomous closure is 0% by design: every change is proposed with a full diff and approved by a named person.
6. Retire duplicate tables after mergers
Platform merges leave duplicate data behind.
The old world. Kept forever.
The new world. Cost Savings & Data Cleanup retires duplicates once lineage proves no consumer remains.
In practice. Two merged platforms run on one set of tables.
What to measure. Duplicate tables.
Designing the autonomy ladder
Autonomy is set per task class, not per tool. This is where we would set each class for a mature deployment, and why:
| Task class | Closed autonomously | Escalated | Handled by a person | Where we set it | Why |
|---|---|---|---|---|---|
| Catalog upkeep | 88% | 8% | 4% | L4 once the receipts are clean | The work is reversible and repeatable |
| Vendor reconciliation | 76% | 16% | 8% | L3: acts and keeps a rollback point | Most cases are routine; the rest escalate with evidence |
| Playback schema drift | 72% | 20% | 8% | L3: acts and keeps a rollback point | Most cases are routine; the rest escalate with evidence |
| Consent checks on segments | 66% | 26% | 8% | L3: acts and keeps a rollback point | Most cases are routine; the rest escalate with evidence |
| Audience-size drift | 56% | 32% | 12% | L3: acts and keeps a rollback point | Most cases are routine; the rest escalate with evidence |
| Reported viewership | 0% | 88% | 12% | L2: always proposed to a named approver | The number carries accountability outside the data team |
The operating model: who owns what
Agents change who does the work, not who is accountable for it:
| Role | Owns | What the agents take off their plate |
|---|---|---|
| VP of Data Product Management at a media company | Standards, autonomy levels per domain and which domain goes next | Assembling status, chasing owners, keeping the catalog current |
| Domain owners and approvers | Reported viewership and sellable audiences | Preparing the diff, blast radius and rollback plan for every proposal |
| Data engineers | Reviewing agent proposals and building new data products | Playback is reconciled against vendor measurement every morning; logging is checked on every app release |
The swarm behind the practices
No single agent delivers these practices. Each one is a hand-off between specialists, coordinated under the autonomy you set per domain.
| Agent | What it does for viewership teams |
|---|---|
| Real-Time Streaming | Keeps playback events, schemas and consumers in step across apps |
| Schema Evolution | Maps app releases and vendor format changes into the viewership model |
| Pipeline Building | Builds unified viewership and audience models across brands |
| Quality Monitoring | Audience-size, completion-rate and vendor tie-out checks |
| Data Access & Governance | Applies consent and brand-level policies to every segment and request |
| Data Security | Classifies subscriber PII and keeps it out of context |
Context Wizard gives DTC, ad sales, programming and finance one governed definition of a view, a viewer and a reached household. Conductor reconciles streaming playback against vendor measurement daily. Spellbook gives every audience and dataset a page ad sales can search.
What disappears
The clearest sign the practices are working is what stops happening:
- •Negotiating the weekly viewership number.
- •Quarterly reconciliation with vendors.
- •Logging changes mistaken for audience behavior.
- •Manual consent checks on segments.
- •Unexplained audience-size jumps.
- •Duplicate tables after platform mergers.
The magic is not any single agent. It is that the back office simply keeps running. Bad data is caught where it enters, not where it is read. Every new table gets quality rules and documentation without anyone writing them. Access follows policy instead of a queue. Fixes are rerun, verified and explained before anyone opens a dashboard. Cost is cleaned up every week instead of every budget cycle. And every one of those actions leaves a signed receipt, so the team can see exactly what happened and roll anything back. For the people on the team, the experience is quieter mornings, fewer tickets and more time for the products the business asked for.
A product manager's scorecard
If you own this data as a product, these are the numbers to bring to every quarterly review:
- •Viewership incidents reaching programming or ad sales
- •Days to explain a vendor divergence
- •Live definitions of a view
- •Segments with consent enforced
- •Duplicate tables retired
- •Share of upkeep autonomous
The climb: from assisted to autonomous to agentic
Our thesis is that the data platform climbs the way analytics did, in stages, and that the hard part of data work was never knowing what to do but doing it. For TV and streaming viewership data teams, the climb looks like this:
- •Assisted. Agents work alongside your team. They read the whole stack, show what needs doing and propose every fix with a receipt; reported viewership and sellable audiences always go to a named approver.
- •Autonomous, under your governance. Routine work runs on its own: playback is reconciled against vendor measurement every morning, logging is checked on every app release, and consent rules are applied to every segment by brand and region. Your team governs the agents instead of doing the upkeep.
- •The agentic enterprise. One viewership number that programming, ad sales and finance all use. People set direction, and the platform carries it out.
You choose the altitude, every step is visible and reversible, and the pilot below is the first rung.
The pilot: how TV and streaming viewership data teams start
The pilot is how your team proves the value on its own data before committing.
- •What we connect. App SDKs and set-top box data; vendor measurement feeds; Snowflake or Databricks; dbt; identity and audience platforms, over MCP, inside your infrastructure. Nothing migrates.
- •Scope. Daily playback-vs-vendor reconciliation.
- •First week. Agents run at L1 across the scoped domain. They map every pipeline, definition and lineage path and show the fixes they would have made, with receipts, so your team sees the value before anything changes.
- •By week two. Playback is reconciled against vendor measurement every morning and logging is checked on every app release start running on reversible work. Reported viewership and sellable audiences stay at L2 with a named approver.
- •At day 30. We review the impact metrics against your baseline:
- •Playback vs vendor reconciled: from about 3 months to 8-15 min
- •Programming question answered: from about 2 days to seconds
- •Sellable segment published: from about a week to 10-15 min
- •the share of catalog upkeep closed autonomously, targeting 88% as the deployment matures
- •What you decide. Whether to expand to the next domain. The pilot fee is credited in full against the first year.
- •Cost. Start with a pilot ($7,500 one-time, credited in full against the first year). Scale is from $1,000 a month and Enterprise from $3,000 a month, billed annually, with unlimited seats, no usage meter and no markup on model spend. See pricing.
The pilot is the start of a longer curve:
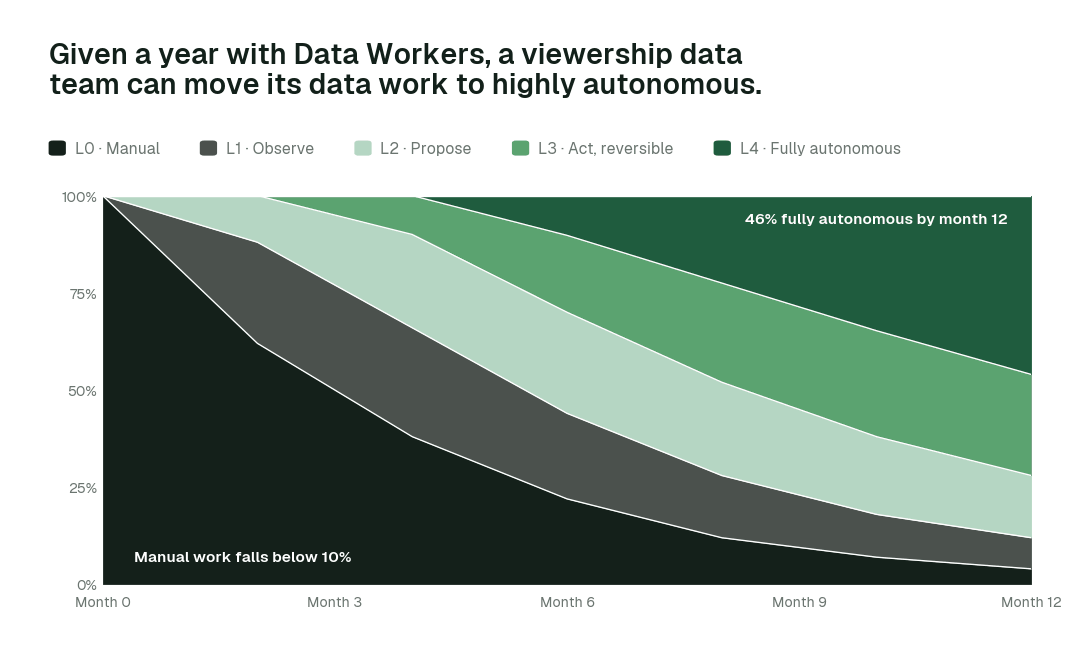
By month 12, more than 46% of agent actions run fully autonomously and manual work falls below 10%, while reported viewership stay with a named approver.
Read the full playbook: Media data platforms and viewership analytics teams