Best practices for agentic private equity portfolio data: a field guide for portfolio data and value creation teams
How portfolio data and value creation teams move their data back office to agents, practice by practice: the state of the space, the old world and the new, what the agents do step by step, how to set autonomy, who owns what, and how to start.
Private equity value creation now runs on data from companies the firm does not operate.
Collecting, mapping and checking that data is repeatable work for agents.
The state of the space
The in-house team at a private equity firm that collects, standardizes and analyzes financial and operational data across portfolio companies, supports value creation plans and integrates acquisitions. It works with CFOs and leadership at each company and reports to the deal and operating partners.
Firms now expect data-driven value creation across every holding, but every portfolio company runs its own ERP, chart of accounts and reporting habits. Value creation teams spend the month collecting and reconciling. Agents can connect to each company where its data lives, map it to one KPI model and keep it current, so the team spends its time on the plan.
The old world
Twelve companies send spreadsheets late; the pack publishes on day 20 with three caveats.
It is rarely one failure. Three patterns repeat:
- •A new platform company. Onboarding a new holding into portfolio reporting takes a quarter.
- •An add-on acquisition. An add-on's data has to merge into the platform company on a 100-day clock.
- •Value creation tracked on live data. Initiatives are tracked in slides.
The new world
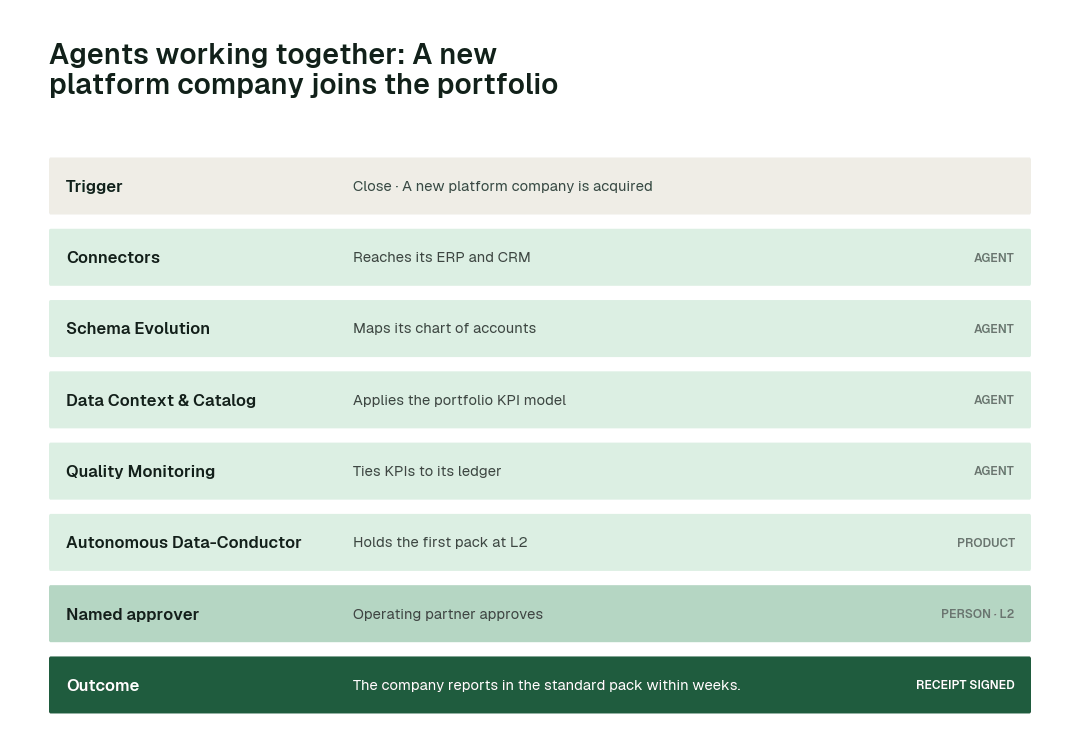
Agents pulled and mapped every company's data on day 2 and the pack was approved on day 4.
Here is that new world as a chain of hand-offs between agents:
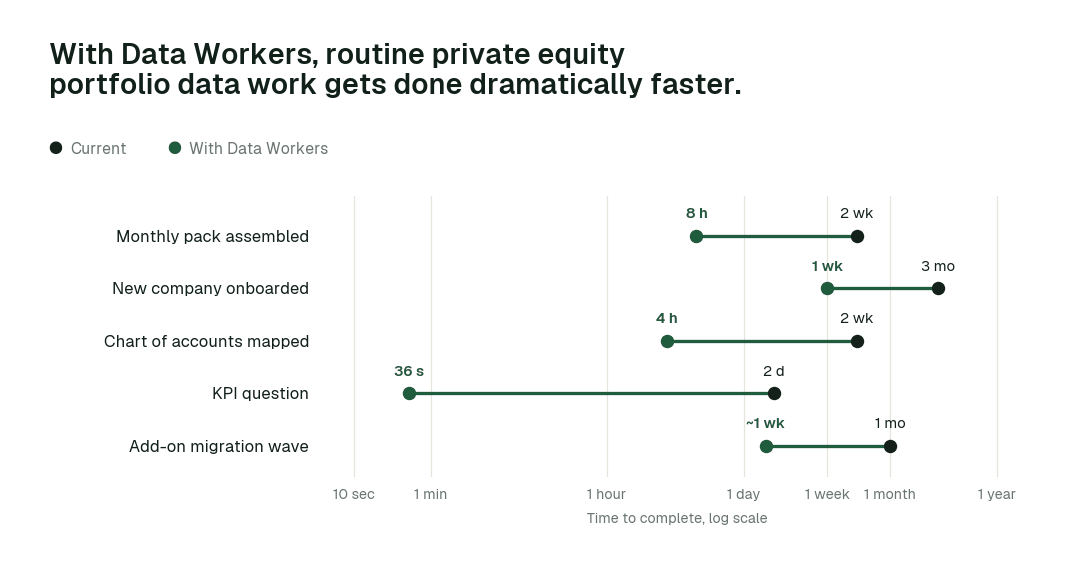
These are the impact metrics we move:
- •KPI question: from about 2 days to seconds
- •Chart of accounts mapped: from about 2 weeks to 4 h
- •Monthly pack assembled: from about 2 weeks to 8 h
The rest of this report walks through the 5 practices that make that possible. At a glance:
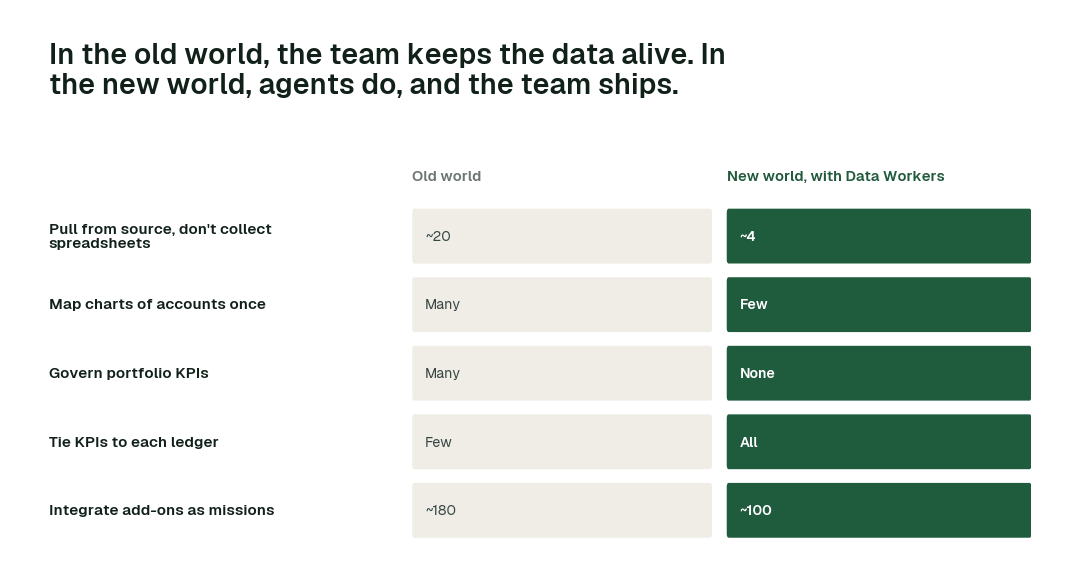
The practices, one by one
1. Pull from source, don't collect spreadsheets
Submissions are late and inconsistent.
Why it is harder than it looks. Every company runs different systems.
The old world. Email.
The new world. Connectors.
What the agents do, step by step:
- 1.The Connectors agent calls
get_connector_statusand reaches each ERP.
- 1.The Data Ingestion agent calls
get_connector_statusand pulls monthly data.
- 1.The Quality Monitoring agent calls
set_slaand tracks timeliness.
In practice. Day-2 data.
What to measure. Day the pack is ready.
2. Map charts of accounts once
Every company differs.
Why it is harder than it looks. Charts of accounts never match.
The old world. Manual.
The new world. Schema Evolution.
What the agents do, step by step:
- 1.The Schema Evolution agent calls
generate_migrationand maps accounts.
- 1.The Pipeline Building agent calls
sandbox_testand tests mappings.
- 1.The Data Context & Catalog agent calls
generate_documentationand documents them.
In practice. Maintained mappings.
What to measure. Hours of mapping per month.
Practices like these compound. Across the routine work they cover:
3. Govern portfolio KPIs
Comparisons need one definition.
Why it is harder than it looks. KPIs mean different things per company.
The old world. Per company.
The new world. Context Wizard.
What the agents do, step by step:
- 1.The Data Context & Catalog agent calls
define_business_ruleand governs KPIs.
- 1.The Data Context & Catalog agent calls
mark_authoritativeand marks sources.
- 1.The Data Context & Catalog agent calls
trace_cross_platform_lineageand adds lineage.
In practice. Comparable KPIs.
What to measure. Conflicting definitions.
4. Tie KPIs to each ledger
Investors expect accuracy.
Why it is harder than it looks. Investors expect accuracy.
The old world. Trust.
The new world. Quality Monitoring.
What the agents do, step by step:
- 1.The Quality Monitoring agent calls
run_quality_checkand ties to ledgers.
- 1.The Incident Debugging agent calls
get_root_causeand explains gaps.
- 1.The Autonomous Data-Conductor calls
request_governance_reviewand routes exceptions.
In practice. Every KPI tied.
What to measure. KPIs tied to ledgers.
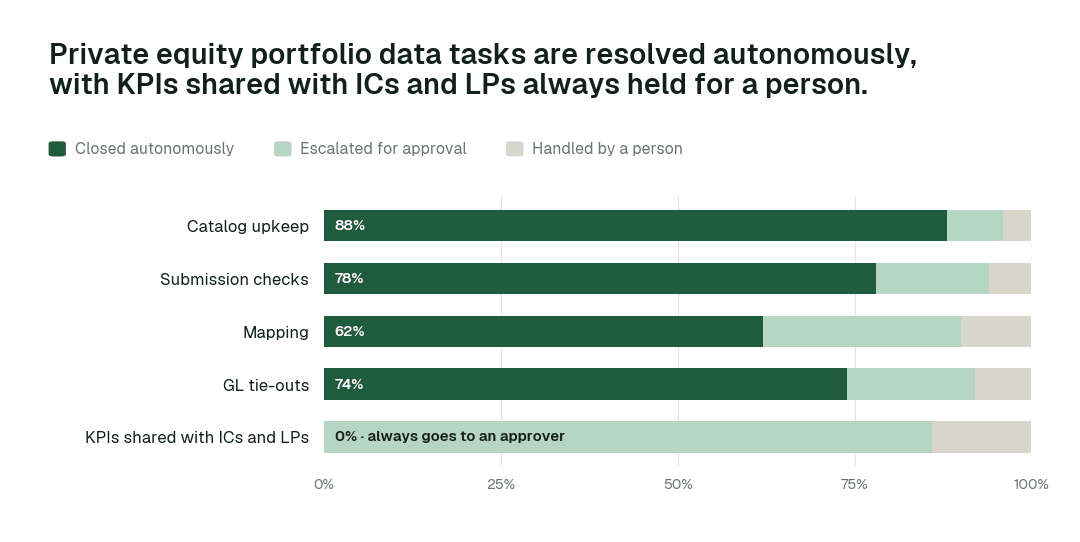
Autonomy where work is reversible, a named approver where it matters:
5. Integrate add-ons as missions
Integration is on a clock.
Why it is harder than it looks. Integration runs on a clock.
The old world. Consultants.
The new world. Data Migration.
What the agents do, step by step:
- 1.The Data Context & Catalog agent calls
blast_radius_analysisand maps dependencies.
- 1.The Data Migration agent calls
generate_migrationand moves workloads.
- 1.The Quality Monitoring agent calls
run_quality_checkand proves parity.
In practice. On plan.
What to measure. Days to integrate.
Designing the autonomy ladder
Autonomy is set per task class, not per tool. This is where we would set each class for a mature deployment, and why:
| Task class | Closed autonomously | Escalated | Handled by a person | Where we set it | Why |
|---|---|---|---|---|---|
| Catalog upkeep | 88% | 8% | 4% | L4 once the receipts are clean | The work is reversible and repeatable |
| Submission checks | 78% | 16% | 6% | L3: acts and keeps a rollback point | Most cases are routine; the rest escalate with evidence |
| Mapping | 62% | 28% | 10% | L3: acts and keeps a rollback point | Most cases are routine; the rest escalate with evidence |
| GL tie-outs | 74% | 18% | 8% | L3: acts and keeps a rollback point | Most cases are routine; the rest escalate with evidence |
| KPIs shared with ICs and LPs | 0% | 86% | 14% | L2: always proposed to a named approver | The number carries accountability outside the data team |
The operating model: who owns what
Agents change who does the work, not who is accountable for it:
| Role | Owns | What the agents take off their plate |
|---|---|---|
| Director of Value Creation, Data and Analytics | Standards, autonomy levels per domain and which domain goes next | Assembling status, chasing owners, keeping the catalog current |
| Domain owners and approvers | KPIs shared with investment committees and LPs | Preparing the diff, blast radius and rollback plan for every proposal |
| Data engineers | Reviewing agent proposals and building new data products | Each company's data is pulled from source and mapped; portfolio KPIs tie to each company's ledger |
The swarm behind the practices
| Agent | What it does for you | Tools it calls |
|---|---|---|
| Connectors | Reach each company's ERP, CRM and BI | get_connector_status, trigger_airflow_dag, get_dbt_run_history |
| Schema Evolution | Map charts of accounts and formats | detect_schema_change, validate_schema_compatibility, generate_migration, rollback_migration |
| Data Context & Catalog | Govern portfolio KPIs and lineage | trace_cross_platform_lineage, blast_radius_analysis, define_business_rule, generate_documentation |
| Quality Monitoring | Check submissions against the GL | set_sla, run_quality_check, get_anomalies, create_quality_tests_for_pipeline |
| Data Migration | Integrate add-on acquisitions | generate_migration, validate_migration, verify_data |
| Data Access & Governance | Scope access by company and fund | provision_access, check_policy, request_governance_review, generate_audit_report |
Data Context Wizard keeps one governed graph of definitions, lineage and owners that every agent and person answers from. Autonomous Data-Conductor runs each job from detection to a verified result. Spellbook Data Catalog is where your team approves, audits and rolls back, and asks questions in plain English.
What disappears
- •Spreadsheet chases.
- •Caveated portfolio packs.
- •Inconsistent KPIs.
- •Consultant-led integrations.
- •Slow LP answers.
The magic is not any single agent. It is that the back office keeps running: bad data is caught where it enters, every new table gets quality rules and documentation without anyone writing them, access follows policy, fixes are verified before anyone opens a dashboard, and every action leaves a signed receipt.
A product manager's scorecard
| Metric | How to read it |
|---|---|
| Day the pack is ready | Baseline it in the first week of the pilot; review it monthly. |
| Mapping hours per month | Baseline it in the first week of the pilot; review it monthly. |
| Conflicting KPI definitions | Baseline it in the first week of the pilot; review it monthly. |
| KPIs tied to ledgers | Baseline it in the first week of the pilot; review it monthly. |
| Days to integrate an add-on | Baseline it in the first week of the pilot; review it monthly. |
Where this goes next
Private equity firms will run every holding on one governed data model, onboarded at close and integrated on plan, so value creation teams spend their time on the operating levers.
The climb: from assisted to autonomous to agentic
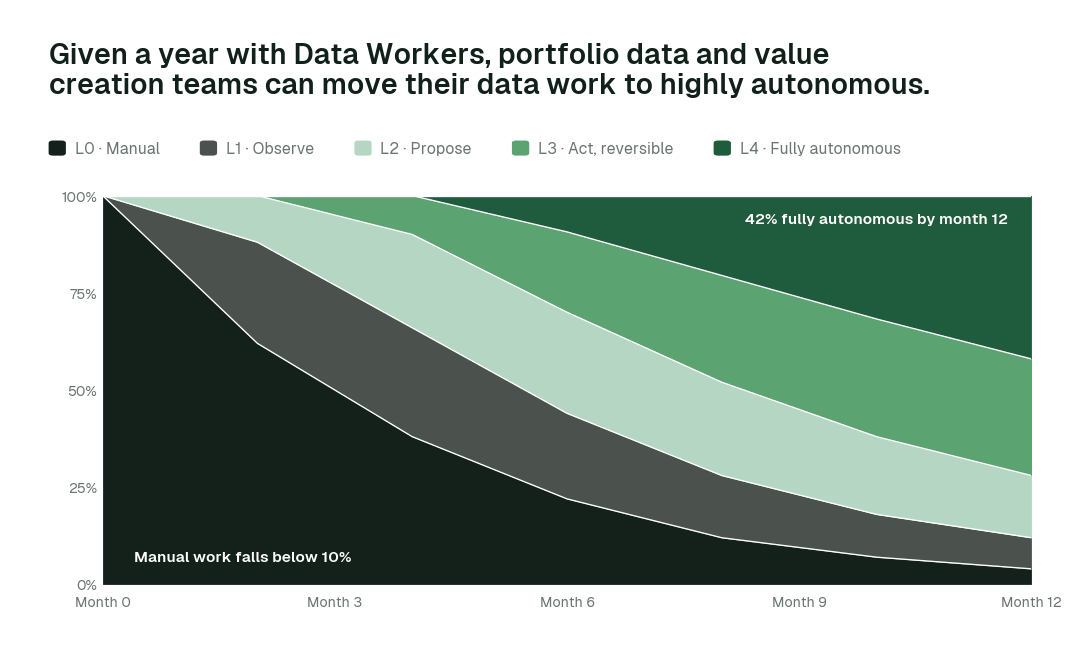
Our thesis is that the data platform climbs the way analytics did, in stages, and that the hard part of data work was never knowing what to do but doing it. For portfolio data and value creation teams, the climb looks like this:
- •Assisted. Agents work alongside your team. They read the whole stack, show what needs doing and propose every fix with a receipt; kPIs shared with investment committees and LPs always go to a named approver.
- •Autonomous, under your governance. Routine work runs on its own: each company's data is pulled from source and mapped, portfolio KPIs tie to each company's ledger, and add-on integrations run as missions. Your team governs the agents instead of doing the upkeep.
- •The agentic enterprise. Private equity firms will run every holding on one governed data model, onboarded at close and integrated on plan, so value creation teams spend their time on the operating levers.
You choose the altitude, every step is visible and reversible, and the pilot below is the first rung.
The pilot: how portfolio data and value creation teams start
The pilot is how your team proves the value on its own data before committing.
- •What we connect. Portfolio companies' ERPs (NetSuite, Sage, SAP, QuickBooks), CRMs and BI; a firm-owned Snowflake or Databricks; dbt; BI, over MCP, inside your infrastructure. Nothing migrates.
- •Scope. Three portfolio companies on one KPI model.
- •First week. Agents run at L1 across the scoped domain. They map every pipeline, definition and lineage path and show the fixes they would have made, with receipts, so your team sees the value before anything changes.
- •By week two. Each company's data is pulled from source and mapped and portfolio KPIs tie to each company's ledger start running on reversible work. KPIs shared with investment committees and LPs stay at L2 with a named approver.
- •At day 30. We review the impact metrics against your baseline:
- KPI question: from about 2 days to seconds
- Chart of accounts mapped: from about 2 weeks to 4 h
- Monthly pack assembled: from about 2 weeks to 8 h
- the share of catalog upkeep closed autonomously, targeting 88% as the deployment matures
- •What you decide. Whether to expand to the next domain. The pilot fee is credited in full against the first year.
- •Cost. Start with a pilot ($7,500 one-time, credited in full against the first year). Scale is from $1,000 a month and Enterprise from $3,000 a month, billed annually, with unlimited seats, no usage meter and no markup on model spend. See pricing.
The pilot is the start of a longer curve:
Read the full playbook: Data Workers for portfolio data and value creation teams